The COVID-19 induced recession of 2020 began with the ferocity of an unexpected tsunami smashing onto the shore—one month the economy was fine, the next it was in freefall.
In February 2019, long before Wuhan saw the first cases of COVID, nearly 80% of economists who contribute to the Wall Street Journal’s consensus survey suggested there would be a recession by the end of 2020—driven by trade wars, inflation, a collapse in real estate, and other “miserabilist” theories that generate headlines.
In February of this year, that share had dropped to 10%. It appears many forecasters were panicked by mirages and missed the real threat to the expansion.
Now with the second quarter behind us, we have a better idea of the damage caused by the pandemic-linked closures of the economy. Consumer spending cratered in March at a level never experienced before. This caused U.S. output to drop almost 12% from the fourth quarter of 2019 to the second quarter of 2020, the sharpest decline ever seen. Unemployment in the nation surged from 50-year lows to 80-year highs in a matter of weeks.
Where Now?
The big question is: where from here? While there are all sorts of witty responses to the forecast letter game, the predictions can largely be put into two camps—the “V” group and the “U” group. While there is no set definition between the two, roughly, the “U” camp sees the pandemic’s damage to the economy as severe enough to suggest a slow, long-term recovery.
Most of the economic forecasts that were released immediately after the start of the COVID crisis suggested a downturn worse than what occurred during the Great Recession—with many tossing around the term “depression” as a descriptor of what was to come.
In contrast, Beacon Economics has been an advocate of the “V” scenario from the start. As dramatically bad as the numbers have been in the last few months, there is simply no reason to expect the current business cycle to be as negative as during the Great Recession given how profoundly different the shock is to the economy.
The Great Recession was the worst business cycle since World War II because the economy had been badly distorted by the subprime credit bubble that preceded it. It took years to repair household balance sheets and to work through excess inventories of homes, cars and other durables. Millions of jobs that had been created by the bubble were lost permanently, and displaced workers had to build new careers in new sectors.
In contrast, the shock that set off the current crisis has none of these long-term characteristics. The economy was well balanced when the pandemic arrived. A collapse in consumer spending occurred, not because people couldn’t spend money, but because fear and caution surrounding the disease itself and government mandates prevented them from spending.
There is no reason to think there will be a permanent shift in the structure of the economy, outside of the pandemic quickening the pace of retail’s capitulation to the internet.
Case for ‘V’
The case for the “V” has been vindicated by recent data. Indeed, the big news is that, officially, the recession has already ended. The National Bureau of Economic Research (NBER) dates the start and end points for recessions based on peaks and troughs of economic activity (www.nber.org).
For example, the peak of economic activity prior to the Great Recession was in the fourth quarter of 2007, while the bottom was hit in the second quarter of 2009. The economy took another 5 to 6 years to fully recover—this is a separate part of the business cycle. The NBER has dated the peak of the last expansion as February 2020 and the trough in April 2020. Since April, economic activity—from housing sales to consumer spending to payroll employment—has been growing sharply.
There are ways that economists can estimate quarterly gross domestic product (GDP) though the use of certain monthly data and interpolation of data that is available only on a quarterly basis.
One estimate from Macroeconomic Advisors estimates that the economy contracted by 16.5% from February to April, and then bounced back by 9.2% through June. If economic activity in the third quarter doesn’t grow at all from June, the United States will still experience a 20% real growth rate in the third quarter—the highest ever recorded.
It’s certainly clear that growth won’t be flat. And while a lot of July data, outside of retail sales, employment and the ISM numbers, are still not available, all this suggests continued growth. The third quarter could approach a 25% to 30% growth rate.
Shifting Predictions
“An economic forecast is an expert who will know tomorrow why the things he predicted yesterday didn’t happen today.”
These surprisingly good numbers have forced some pessimists to sharply alter their projections upwards (some have attempted to spin their misses in the press in recent months). But most prognosticators continue to predict a long, painful recovery.
The current outlook from the Congressional Budget Office (CBO) is a good example. The CBO’s most recent forecast suggests a full recovery will take close to a decade—similar to the amount of time it took to recover from the Great Recession. But given the current trajectory of the economy, it’s likely they will have to upgrade their forecast in the coming months.
The key issue with the more bullish “V” outlook has been the unfortunate second surge in new COVID-19 cases that began in June. Increased economic activity, a lack of consistent and forceful public policy, and a basic decline in Americans’ fear of the virus has driven an escalation of new cases in places such as Texas, Florida, and Arizona, which didn’t formerly have high numbers.
This isn’t, by the way, the second wave that many experts were discussing early on in the crisis, where a place like New York City would see a big second surge in new cases. At its peak, the United States was experiencing about 200 new cases per million people per day.
The silver lining is that this second wave has not led to a huge number of new deaths or overwhelmed hospitals. Moreover, it has begun to subside; as of August 17, the nation was recording 140 new cases per million people per day.
Reasons for Optimism
While this second wave has shifted the date of full recovery out modestly relative to earlier predictions, Beacon Economics remains certain that a quick recovery will occur once the virus is under full control. This optimism is based on a number of observations.
• As dramatically bad as the second quarter numbers were, there is also plenty of evidence indicating that the shocks to the system were largely transitory. For example, the enormous surge in unemployment was not driven by true job losses but by temporary layoffs. The share of the labor force who were truly unemployed (either lost their job permanently or have entered the labor market and are looking for work) was slightly over 4% in July—substantially lower than the 8%-plus rate seen at the peak of the Great Recession, and not yet as high as during the very mild tech recession of the late 1990s.
• Consumer spending, not surprisingly, is where most declines in economic activity have taken place during the current crisis. But the damage largely occurred in April. Much of the decline was in restaurants, travel, and personal care services, as would be expected. But over one-third of the decline in consumer spending was in health care consumption. Health care is not a cyclical sector; it didn’t experience a single quarter of lower spending through the Great Recession, nor did it lose jobs. The hit this time was not driven by reduced demand but because the health care system deferred nonessential visits until the virus was brought under control. This is simply spending delayed, and will help the bounce in economic activity in the second half of the year.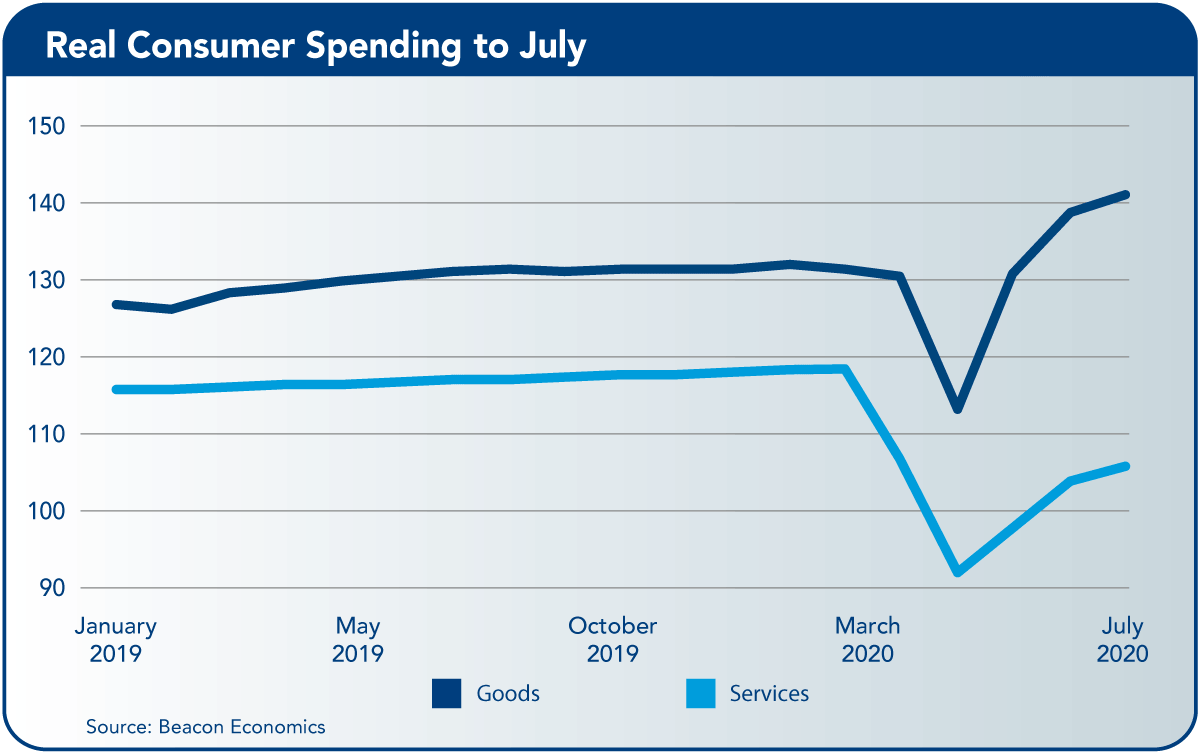
• One of the more pessimistic predictions at the start of the pandemic was the “W” recovery—where economic activity would again spiral downward with another surge in the virus. But the economic impact of the first and second surges couldn’t be more different. In March, there was an unprecedented collapse in consumer spending. In July and August, the most that can be said is that the surge slowed the recovery in consumer spending. Additionally, there was an expectation that July’s labor figures would be flat and unemployment would rise. Instead, another surprise: payroll jobs rose and unemployment fell despite the number of new cases. Businesses and consumers have adapted—an important factor that is often left out by forecasters. Even if a true second wave of cases did occur, it is clear that the economic impact wouldn’t approach what happened the first time.
• The underlying strength of the economy at the start of the pandemic has been reinforced by excessive—yes, that is the appropriate word—stimulus spending. Congress’s first pass at stimulus came in at almost $3 trillion. Putting aside the well-deserved criticism of how poorly thought out these programs were from an operational standpoint, the cash that was put into the economy is vastly more than what was lost. Earned incomes didn’t drop nearly as much as expected, about $260 billion less (seasonally adjusted, not annualized) in the second quarter compared to the previous three months for workers and proprietors.
On the other hand, the increase in government benefits, unemployment, and direct payments increased by $600 billion. The U.S. government paid people more than $2 for every $1 of lost income—albeit it probably has not been distributed proportionately to income losses. And spending dropped by $400 billion. The difference ended up in consumer savings, which shot up to almost $1.2 trillion, four times what it was in the fourth quarter of 2019. That $900 billion in excess savings will undoubtably be spent once life returns to normal. Unlike the Great Recession, where there was a collapse in net worth that hurt spending for years, in the current crisis, net worth is increasing.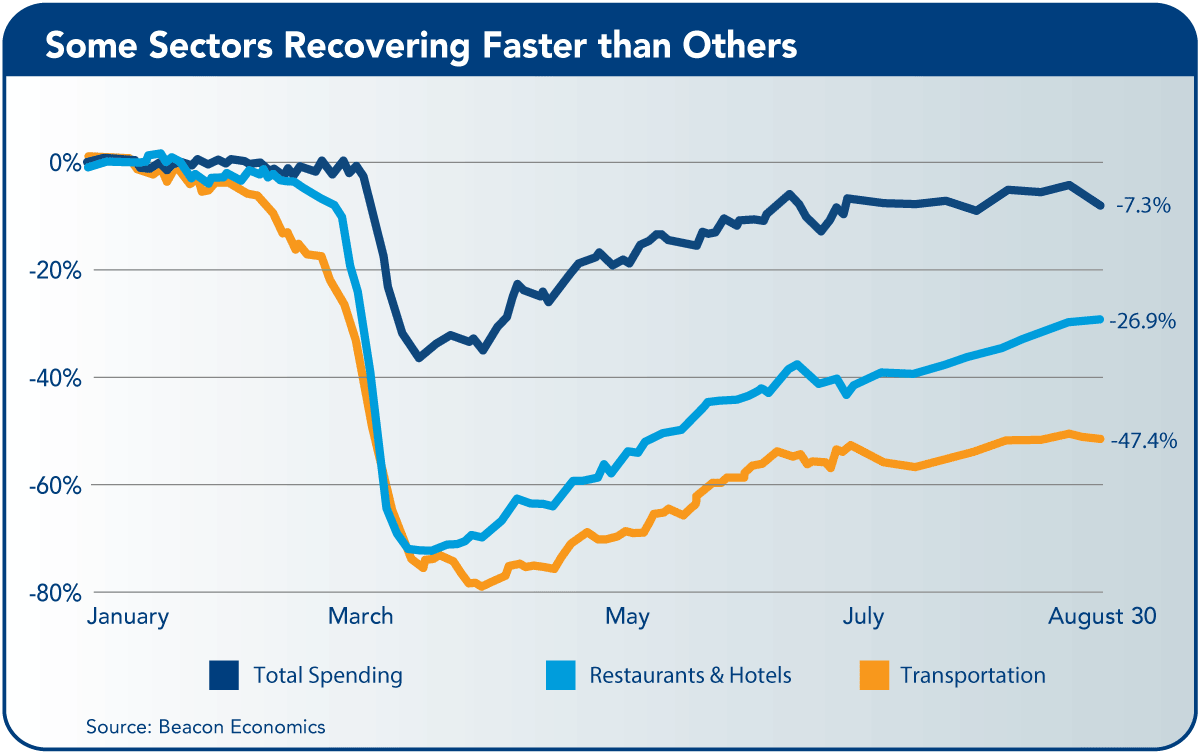
• The numbers above will be accentuated by additional payments in July. And of course, none of this includes all the payments that went to limited liability companies (LLCs) and corporations through the Paycheck Protection Program. It is understandable why the Federal Deposit Insurance Corporation (FDIC) is reporting one of the most dramatic surges in commercial bank account deposits ever seen—$2.2 trillion in three months. This is the dry powder that will fuel a rapid recovery. Data from the New York Federal Reserve showed consumer debt delinquencies falling, not rising, in the second quarter. And while there have been a few big-name bankruptcies, most have been among companies that were already on the brink due to broader trends in the economy. The financial Armageddon that was predicted by many of the talking heads on network television seems pretty far away.
Return to Normality
There is little doubt that the nation still has a ways to go to return to normality, but these recent trends clearly demonstrate the underlying strength of the U.S. economy, which is allowing it to weather the COVID storm and will allow it to rapidly bounce back to normal levels of activity once the virus is brought under full control. Continue to believe in the “V,” just a modestly wider one than before.
Clearly some sectors will do worse than others. Business hotels, restaurants, airlines, and leisure and recreation firms will all lag the recovery for obvious reasons. Retail is far and away the biggest flashpoint. That sector has been struggling with oversupply even as the internet continues to wrestle market share away from traditional brick and mortar stores. The non-store share of retail sales went from 14.7% in January to 17.4% in July, and it’s unlikely to give much of that back.
There will be stressors in the coming months regardless of the strength of the recovery. Undoubtably, a portion of the 9 million people who in July still classified themselves as being on temporary layoff will find themselves in the permanently lost job category.
And while in the aggregate things are good, we also know that the fiscal stimulus did not adequately protect everyone. The blunt and poorly thought out systems that were implemented have guaranteed that a lot of the stimulus money went to places it was not actually needed. Global supply chains will also remain in turmoil as the virus continues its expansion into new parts of the world.
But it is easy to overstate the aggregate impact of these stressed sectors. Together, they represent less than 5% of U.S. GDP. Additionally, these sectors have mitigated at some level. Retail sales at restaurants in July are only about 20% below where they were last year. And a lack of spending in some sectors is driving opportunities in other parts of the economy—campers and bikes are selling like crazy, while golf courses and local drive-to hotels are busier than ever.
Concerns
There are two major concerns to pay attention to as the recovery continues.
• The first has to do with the spread of the virus itself. The United States has experienced a second surge in cases, and it’s possible there could be a third. Notably, the second surge is almost over without the massive public health regulatory controls implemented in the first wave. In other words, shutting down restaurants, nail salons, and malls does not seem to be the most effective way of controlling the spread of the virus. Controlling transmission is about not gathering in large groups, wearing masks, and washing hands.
That personal behavior may be more important than government regulation in controlling the virus is supported by a recent report from the NBER (www.nber.org).
Sweden, for all the criticism that nation faced for its lax regulatory response to the virus, has seen its rate of new cases drop to the same level as the European Union overall in recent months.
And without any closures. Japan has been the wonder story. Despite being the third nation in the world to identify COVID cases, it still has fewer than 500 cases per million people compared to the United States’ 16,000. Governments need to worry less about regulating businesses and more about regulating people.
The rebound in the economy will continue, but the speed of the recovery is completely contingent on keeping the virus in check. On the current trajectory, expect U.S. unemployment to fall to 7% or lower by year’s end and the nation’s economy to be almost fully recovered in 2021. If there is a third surge, however, that date may have to be pushed back yet again.
• The second concern is the U.S. government’s “over” stimulus. Despite clear resilience in the economy and pent up demand that is ready to spring once the virus is under control, amazingly, Congress is discussing a second aid package and are tossing around numbers as high as the first—$3 trillion or more.
While this will supercharge the economy, it also suggests that the U.S. government will be borrowing $4.5 trillion to $7.5 trillion this year—18% to 33% of national GDP. Never has the U.S. government borrowed so much in either absolute or relative terms. To put this in context, the overall U.S. economy has been adding $3 trillion to $4 trillion in total public and private debt per year over the last few years.
In June alone the federal government borrowed more money than it had in all of 2019. During the worst year of the Great Recession, the U.S. government borrowed slightly over $1.3 trillion, and that was enough to set off the backlash that came to be known as the Tea Party. Amazingly, there doesn’t appear to be a single person left in Washington who is worried about the current pace of borrowing. We seem to have allowed the “miserabilism” of our times to make us forget that this money will have to be paid back by our children and grandchildren—as they struggle to cope with the ever-rising cost of entitlements for baby boomers, who are retiring in droves.
This borrowing will have consequences. Right now, there is little issue with raising the funds—between record deposits in the banking system and aggressive quantitative easing by the Federal Reserve, there is plenty of loose cash in the system. But what happens when the virus is conquered, and the population rushes to catch up on life? Spending will jump, the money supply will expand rapidly, and the federal government will be sucking up liquidity in every direction. This a recipe for accelerating inflation and rising interest rates.
Moreover, it will be a completely different circumstance from what happened after the Great Recession. The collapse in wealth at that time kept spending in check as households worked to rebuild their balance sheets. And the decline in private sector debt kept money supply growth in check. In fact, the Federal Reserve had to keep rates near zero just to keep the money supply growing. This is why rates were so low in the years following the recession. Not this time.
If the Federal Reserve fails to aggressively back off on quantitative easing this time, the sharp increase in velocity will cause inflation to heat up, which will put even more pressure on interest rates. All of this sounds a lot like what happened in the late 1970s, in the era of stagflation, when the nation’s fundamental economic growth slowed due to the start of deindustrialization even as excessive monetary growth caused inflation to accelerate to the worst pace ever seen in the modern U.S. economy.
The next (future) hit to the economy could end up looking very much like what happened in the early 1980s when Paul Volker put the hard stop on inflation, which was good for the long run, but in the short run caused the United States to experience a deep recession.
California Outlook
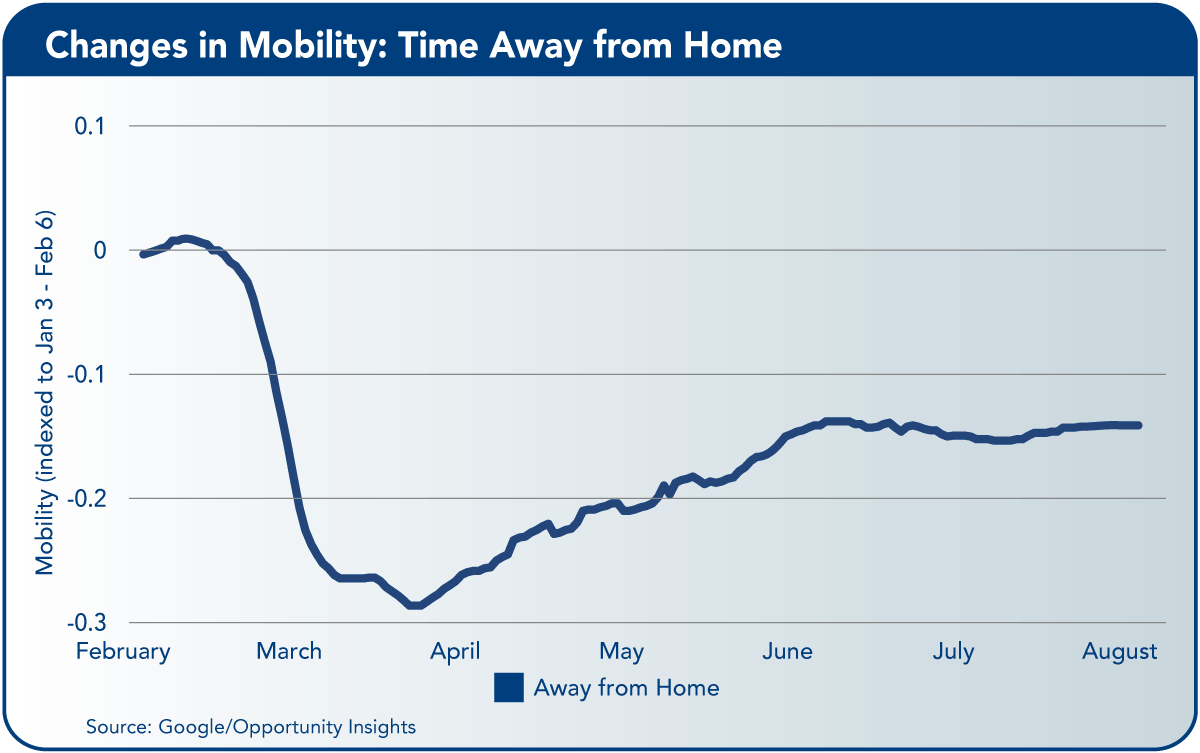
These are unprecedented times for California. New economic records are set, both positive and negative, on a monthly basis. As of this writing, 42 of the state’s 58 counties are currently on the state’s COVID-19 watch list, which means bans on a significant number of indoor activities including gyms, restaurant dine-in service, museums, indoor malls, and hair salons. At the same time, mobility data reveal that people have remained cautious about venturing out. The magnitude of the economic shock will ripple throughout the economy, affecting labor markets, budgets, both state and local, as well as real estate markets.
With respect to local budgets, communities that are heavily reliant on the transient occupancy tax will see sharp drops as the peak summer travel season has come and gone in the middle of the pandemic. This will severely disrupt local service provision for these communities.
At the state level, plans are being made to cover revenue shortfalls. Recessions create a double whammy for state budgets. They create greater expenditure on social services at the same time that revenues decline. Around 70% of the state’s budget comes from income and capital gains taxes.
While the stock market has returned to all-time highs, which is positive for capital gains revenue, the unemployment rate remains at historically elevated levels. Since many job losses have fallen disproportionately on lower-income earners, higher-income earners have fared better, providing a measure of support for state revenues. That said, high-income earners have not been immune to job losses, and ultimately, the magnitude of California’s revenue losses will be tethered to the recovery of the state’s labor market.
Coronavirus in California
In August 2020, California hit some unwelcome milestones. More than 600,000 people have tested positive for COVID-19 in the state, and more than 11,000 residents have died as a result of the virus. On a per capita basis, at nearly 16,000 cases per million residents, the state has seen fewer cases than the national average of nearly 17,000 residents per million. The number of virus-related deaths in the state has been much lower than the national average, with nearly 300 deaths reported per million residents compared to more than 500 nationally.
The number of new cases in the state has plateaued and there are early signs that new cases are starting to fall. As of August 16, the average number of new cases over the previous 7 days stood at 9,137, compared to a peak of more than 9,600 cases for the previous 7 days on July 25 (the peak). There has been a significant drop in the number of COVID-19-related hospitalizations in California, falling from a peak of nearly 9,000 patients at the end of July to fewer than 6,500 patients as of the August 16.
Beyond important public health concerns, containing the spread of virus is critical for the state’s economy since the economic recovery that has been underway since April has slowed following the resurgence in new cases.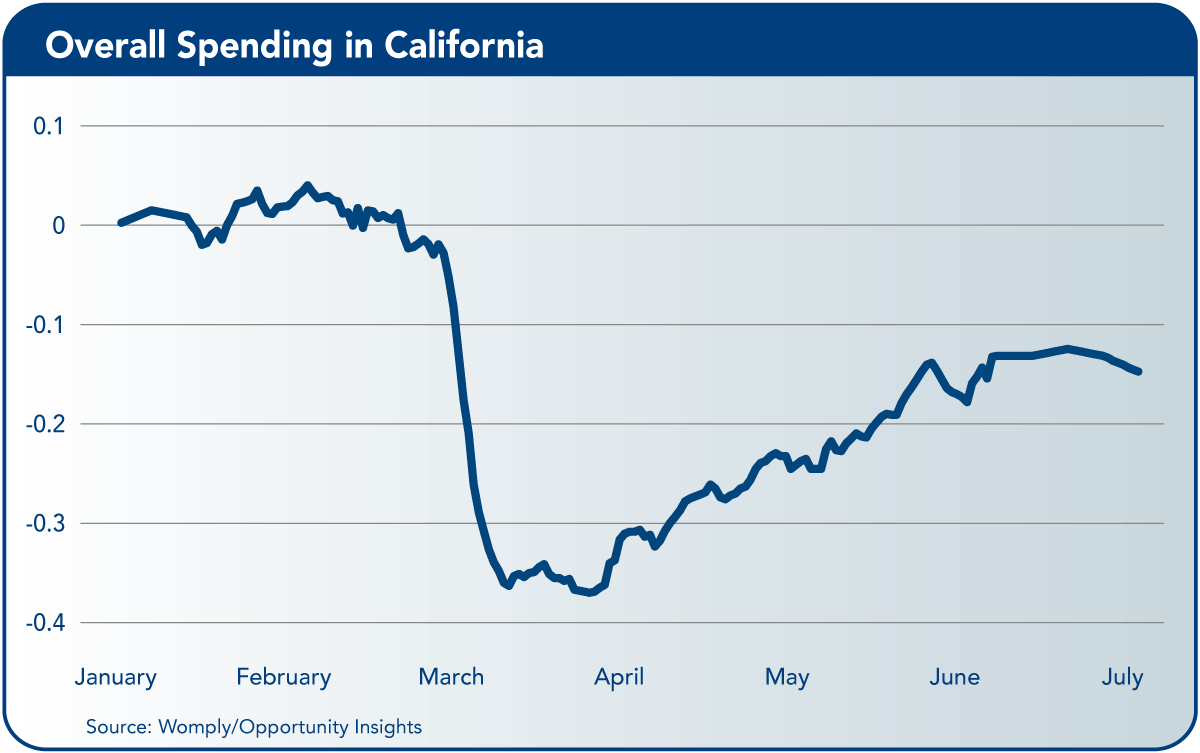
Labor Market Recovery
California’s labor market continued to recover from the effects of the COVID-19 pandemic in July, with total nonfarm employment in the state expanding by 140,400 positions. The rate of job growth slowed compared to June, when 558,200 total nonfarm positions were added by the state’s employers.
The slowing rate of job growth is in large part due to the reaction to the resurging spread of the virus throughout June and July, leading the state government to reimplement certain business closures and constraints on business activity in the second half of July. The hope is that job gains will accelerate later in the year, once the virus is better contained, but given that the spread of the virus has continued into August, it’s likely August will look more like July than June. A strong but not “blow-out” month of job gains.
Despite the nascent labor market recovery, year-over-year employment growth in California stands at -9.4%, one of largest annual declines on record. In July 2020, there were more than 1.6 million fewer people employed in the state than in July 2019. California has continued to perform slightly worse than the nation, where nonfarm employment declined by 7.5% over the same period. This is in large measure due to the more aggressive stance taken by state leaders to contain the spread of the virus than in other locations.
From July 2019 to July 2020, 1.7 million workers were added to the state’s unemployment ranks. California’s unemployment rate declined to 13.3% in July, a 1.6 percentage-point decline relative to June, but a far cry from the 4.0% rate enjoyed one year ago. A small majority of those who have joined the unemployment rolls still report the nature of their unemployment as temporary. However, the number of people who identify as being temporarily unemployed has been shrinking in recent months, a worrisome sign that many layoffs are turning permanent.
The largest job losses have been concentrated in the state’s Leisure and Hospitality sector, where 620,000 fewer workers are employed compared to one year earlier, a 30% decline. Other significant job losses have occurred in the Government, Retail Trade, Other Services (a sector which includes hair and nail salons), and Healthcare and Social Assistance sectors of the economy. Of course, these are the sectors that have been the most vulnerable to the spread of the virus since the in-person nature of their activities has meant their operations have been curtailed through government mandates and consumer reticence. Again, once the spread of the virus is contained, these sectors should see significant job gains.
The biggest job losses, in terms of percentage change, have occurred in Santa Cruz (-14.7% year-over-year), San Luis Obispo (-13.3%), Salinas (-12.4%), and Oakland-Hayward-Berkeley (-12.2%). Three out of four of these places are home to major universities and have suffered from a lack of student spending at local businesses as instruction has moved online. Since remote learning will continue into the fall, we can expect the performance of these locations to lag the labor market recovery in other regions.
Unemployment rates are elevated in a number of regions, most notably Los Angeles County, which as of July had an unemployment rate of 17.5%. Los Angeles is home to a number of industries for which remote work is not well-suited. Beyond tourism, retail, and dining, Los Angeles County has a large concentration of workers in health care, as well as entertainment, industries which require workers to be on location. The inability to work from home in these sectors has led to elevated levels of unemployment in the county.
Recovery on Ice
Despite the strong performance of California’s labor market in June, the pace of the recovery has undoubtedly slowed since then. This is clear in the employment numbers, where the rate of job growth fell significantly from June to July. We also see evidence of a slowing economy in so-called “high frequency data.”
Nonconventional data sources deliver an interesting perspective on the economy, providing data that is more timely than traditional data sources. Consumer spending data, gathered by Affinity Solutions, reveals a sharp recovery in consumer spending in California through April and May, which began to stall at the end of June, as the number of new COVID-19 cases surged in the state. Over the period from June 21 to August 2, consumer spending in the state was flat. As of August 2, it was 15% lower than in January 2020. Consumer spending nationally was 8% lower over the same period.
The key lesson from the Overall Spending in California chart is the extent to which the speed of the recovery is shaped by the spread of the virus. As the virus’s transmission in the state slows, consumer spending should increase.
That being said, the federal government’s inability to extend additional unemployment benefits will act as a head wind to consumer spending in California. The recovery in consumer spending was fueled in large part by enhanced unemployment benefits from the federal government, which provided unemployed workers with an additional $600 per week beyond what they would normally receive from state governments.
Given the high number of unemployed workers in the state, the cut in additional unemployment benefits will represent the equivalent of a major pay cut for California’s unemployed. This will undoubtedly act as a drag on consumer spending until the labor market recovers.
Mobility data is another widely used measure of “real-time” activity. The data are based on people’s mobility as recorded on Google Apps. The Changes in Mobility chart measures the amount of time people spend at home—in other words, it’s a measure of time spent away from workplaces and recreational activities. These data reveal a very similar pattern to the consumer spending data: the recovery in economic activity stalled as the number of new cases in the state grew—and has been stalled since. These data run until the middle of August.
Fixing a Hole
Given the trauma sustained by the California economy, the key question centers on how long it will take the labor market to recover. The 1.7 million jobs lost will not return to the economy overnight, even after the spread of the virus is fully contained.
There are two components to the labor market recovery. First is replacing the jobs that have been lost, which would only return the labor market to where it was before the pandemic began. The economy should have been adding jobs over this period under normal circumstances. In 2019, the state’s economy added roughly 22,000 jobs per month. For each month that it takes to return to the pre-pandemic level of employment, the state is effectively losing a further 22,000 jobs per month, based on the 2019 trend.
As mentioned above, 140,000 jobs were added to the state’s economy in July. This is a positive sign, but to place this figure in context, if we continue to add jobs at this rate, it would take until August 2021 to return the labor market to the position it was in in February 2020. Since the labor market normally would have been adding 22,000 jobs per month over this period, based on 2019 employment figures, this means that in August 2021, the economy would still be 250,000 jobs behind trend.
Job growth in California will also slow in the second half of 2021. As the recovery proceeds and the majority of jobs lost are replaced, the rate of job growth naturally slows.
Even if in the second half of 2021 the number of jobs added to the state each month is double the number of jobs that were added each month in 2019, which would be a historically high figure, it would take a further year for the labor market to return to the pre-pandemic trend.
Of course, predicting the precise rate of job growth over the next two or three years is not an exact science, but this hypothetical scenario illustrates the depth of the labor market hole, and how long it will take to fully repair.
 The California Chamber of Commerce Economic Advisory Council, made up of leading economists from the private and public sectors, presents a report each quarter to the CalChamber Board of Directors. The council chair is Christopher Thornberg, Ph.D., founding partner of Beacon Economics, LLC. The California Outlook section was prepared by Taner Osman, Ph.D., Beacon Economics. Graphics are a selection of those presented at the CalChamber Board meeting via Zoom on September 11.

