S&P 500 Off to Strong Start
Following a steep sell-off in the first half of 2022, the Standards & Poor 500 started 2023 with an impressive +15.9% first half return, ranking as the second strongest first half return since 2000, behind only 2019 and ahead of 2021.
Contrary to the market’s forecast, the U.S. economy has remained surprisingly resilient. The economic data and growth rates aren’t necessarily as strong as 2021 and 2022, but they are coming in above forecast.
 Return Drivers in S&P 500
The S&P 500 is market cap weighted, which means its return can be driven by the biggest stocks. Tracking the median stock lets us know if the gains are top heavy (i.e., only the biggest stocks) or more widespread.
The gap indicates that while the S&P 500 recorded a strong first half gain, the median stock produced a significantly lower return.
There is a similar story with year-to-date returns at the sector level. The top three performing S&P 500 sectors — Technology, Consumer Discretionary, and Communication Services — have gained around 30% to 40% year to date, while the remaining eight sectors have either produced single-digit positive returns or negative returns.
Handful of Stocks Driving Gains
A factor contributing to the S&P 500’s exciting start is centered around AI (artificial intelligence). AI has the potential to revolutionize the economy. The spotlight started in November 2022 when OpenAI released its text-generating AI chatbot called ChatGPT. The company offered a free version, and less than 2 months later, OpenAI reported there were 100 million active ChatGPT users.
For comparison, it took Facebook 4.5 years to reach the 100 million user milestone, while Twitter took five years and Netflix took 10 years.
 Is Market Cheap or Expensive?
There is a significant amount of valuation dispersion in the equity market. Large Caps trade above their 80th percentile and near a 19x next 12-month price-to-earnings (P/E) multiple, an indication the group trades at a premium versus history.
What accounts for the valuation premium? Growth stocks account for a significant portion of the S&P 500 and currently trade above their 80th percentile and at 27x P/E multiple.
To summarize, Large Caps are expensive because Growth is expensive.
The takeaway: Large Cap and Growth stock valuations appear stretched near-term, but valuations across other equity factors may be more reasonable. The risk for those other factors is their earnings may decline if the economy slows, while Growth earnings may be more resilient given technology’s outsized role in the economy.
Is the Fed Having Any Impact?
The leading economic index (LEI) declined -8% during the last 12 months, an indication the U.S. economy is slowing and potentially near a turning point. This is to be expected as the Federal Reserve raises interest rates and the economy returns to its pre-pandemic trend after a period of strong economic activity.
At the same time, the composite economic index (CEI) rose +2% during the last 12 months, an indication the current state of the economy remains strong. The rising CEI doesn’t mean the economy has avoided a recession, but it indicates that as of today the overall economy remains resilient despite the Fed’s 5% worth of rate hikes.
Since 1960, the U.S. economy has been near a recession each time the LEI declined by more than -5% in 12 months. The Fed knows it’s making an impact and that higher interest rates affect the economy with a lag, but it also knows there was a large amount of stimulus dumped into the economy via low interest rates and government spending.
U.S. Bankruptcies Rising
The number of bankruptcy filings in March 2023 crossed above the median for the first time since December 2020, bringing the number of filings back in line with the pre-pandemic trend.
What’s driving the increase? Higher interest rates, tighter bank lending standards, and easing inflation.
To summarize, higher interest rates and tighter bank lending standards are increasing companies’ financing costs at the same time inflation is easing and companies are losing pricing power.
For context, bonds rated CCC and lower are perceived to be significantly riskier with higher rates of default and highly leveraged balance sheets.
Examples include Norwegian Cruise Lines, which is still repairing its balance sheet from the drop in travel during the pandemic, and Community Health Systems, an operator of hospitals dealing with too much debt after it was bought by a private equity firm.
While more companies are filing for bankruptcy, the lowest-rated and riskiest bonds are outperforming.
What’s driving the outperformance? Higher yield.
An index of corporate investment grade bonds yields 5.59%, while an index of CCC bonds yields 14%, almost 2.5x higher. High yield offers more income, but that income is tied to credit risk, which may mean more defaults and capital losses.
TSA Checkpoint Travel Reaches New High
Data from the Transportation Security Administration (TSA) shows the number of travelers passing through checkpoints has already surpassed 2019 levels multiple times this year.
In the stock market, airlines continue to report strong travel demand and raise their financial outlooks, citing the consumers’ willingness to keep spending.
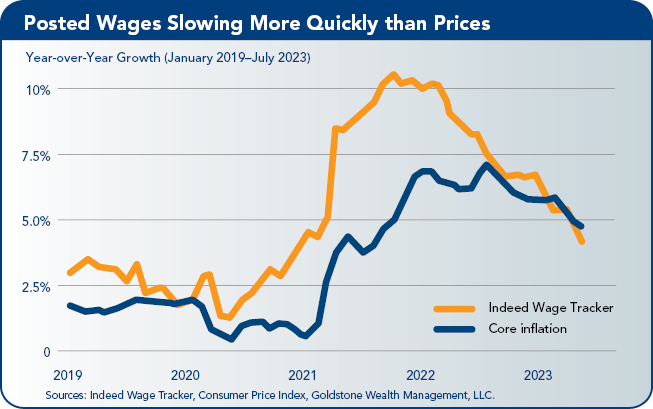
Increased travel is encouraging and another indication the economy is returning to normal, but it also complicates the Fed’s efforts to tackle inflation. The central bank knows higher interest rates slow the economy, which eventually reaches the U.S. consumer and slows spending.
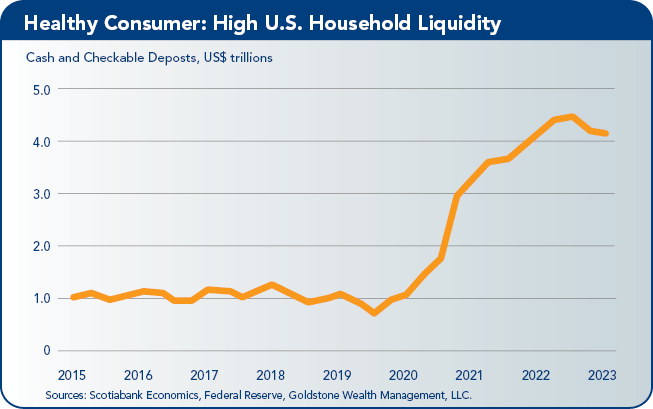
Consumer spending remains strong, however, and could prevent inflation from easing. The Fed faces a very difficult balancing act between doing too much and not doing enough.
Staff Contact: Nicole Wasylkiw
 This economic outlook report is adapted from the special report presented to the CalChamber Board of Directors by Dr. Sanjay Varshney, Ph.D., CFA, principal, founder and chief economist, Goldstone Wealth Management, LLC.

