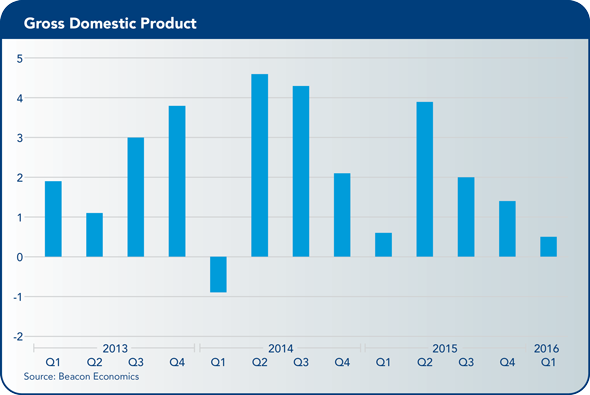
 The U.S. economy started off on a down note in 2016, with gross domestic product (GDP) growth slowing to a paltry 0.4%, even as the financial and commodity markets have continued their wild ride. The global commodity glut and the slowing world economy are the proximate drivers of the weak numbers.
The good news is that these shocks have already inflicted their maximum damage on the U.S. economy, and core drivers of growth, such as consumer spending, are more than strong enough to push the economy through these problems. As such, most economic forecasters continue to forecast growth in the 2% to 2.5% range for the rest of the year.
The medium term outlook also is benign. There are plenty of reasons why the United States’ economy will not grow as rapidly as everyone would like over the next couple of years, but few that would lead you to believe the nation’s economy will stop growing. The slow pace of growth may even be an underlying strength as the surest path to a downturn often comes from major imbalances that form in the heady days of a rapid economic expansion.
Right now the United States is in the seventh year of this expansion, already the third longest on record, and will likely end up as the longest. Sometimes it pays to be a tortoise—particularly when that tortoise offers the relatively high quality of life that so many Americans enjoy.
Consumers
Consumer spending slowed sharply at the start of the year—the third year in a row that such a pattern has emerged. Auto sales in particular tumbled from the torrid pace they were on at the end of last year. But this pull back is surely temporary given that the labor and credit markets remain solid.
The U.S. economy added more than 2.7 million jobs last year, and it has remained on track this year with 628,000 jobs added in the first three months despite slower growth. The headline unemployment rate remains below 5%, and the labor market tightness is finally starting to draw new workers into the labor force—participation rates have started to rise.
More important, incomes have been rising. Real disposable personal income is up 3% from where it was last year at this time, and saving rates are up to their highest level since 2012. Average household net worth in the United States hit a record $738,000 at the end of 2015. Credit markets—while still too tight—have loosened a bit and consumer credit is back about $12 trillion for the first time since the great recession.
Consumers are being boosted further by falling interest rates and the deleveraging that has occurred over the last few years—pushing the financial obligations ratio, the share of household income used to pay for debt obligations, down to its lowest level ever.
In short, there is no reason to think that consumers are likely to continue to tighten their belts as we continue into 2016. The one and only data point available for the second quarter—auto sales—backs this up, with a bounce back to a 17.5 million-unit seasonally adjusted annual rate (SAAR).
Construction
The residential industry has been one of the slowest recovering sectors in the aftermath of the great recession. Single-family housing starts are still under 800,000 (SAAR), far less than the stable number of 1.1 million to 1.2 million.
Inasmuch as the recovery is slow, however, it also continues to have room for growth. Re-sales are running at a steady pace, and as noted, credit is slowly easing for borrowers. Home prices are still quite affordable given low interest rates. Most importantly, strong labor markets have caused the pace of household formation to accelerate, and housing vacancies to fall. As such, while the sector will likely continue to underperform from a long-term standpoint, it will continue to be on an upward trend pushing the U.S. economy forward.
The nonresidential side of things is looking good with one major exception—mining. Real spending on nonmining new structures hit their highest point in the first quarter of the year on better numbers for a broad range of products including manufacturing facilities and commercial developments.
Mining
The commodity glut has had a dramatic impact on the world economy over the last 18 months—including parts of the U.S. economy. The most obvious example is low crude oil prices that have largely collapsed the pace of drilling of new wells. The low prices are exclusively a supply issue—driven by the increase in U.S. shale oil production. There is little sign that the glut will end anytime soon. Production is still close to peak, and stocks of crude in storage have never been higher.
The collapse in mining will not sink the U.S. economy. The sector is simply too small—as past episodes have shown. The 135,000 mining jobs lost in 2015 were a tiny fraction of the 2.6 million net jobs added overall.
While the contraction is creating financial distress for some lenders, and hits some local economies hard, it isn’t having much of a broader impact. Houston is still experiencing job growth—although at a much slower rate than two years ago, and Dallas continues to grow at a rapid pace.
Part of the offset is that, unlike in the past, the United States is still producing a lot of oil. And as soon as prices reach $50, it will again. In past cycles, the nation was shut out by cheaper foreign supply. Today, the United States is the cheap supply.
In the meantime, the benefits of cheap commodities to households, businesses and the trade deficit will continue to help the U.S. economy grow this year.
Exports
The final worry is the troubled global economy and its impact on U.S. exporters. Despite a slowdown in China, commodity-producing nations that are in various states of economic distress, and a strong U.S. dollar, exporters managed to increase their overseas sales in 2015 over the previous year by a small amount. The widening trade deficit last year was driven by imports, as U.S. consumers ramped up spending. Indeed, U.S. exports have proven how competitive they are by faring decently in an extremely adverse environment.
Today, China is working hard to stabilize its economy—and some recent evidence suggests that growth has stabilized. While that nation clearly faces large challenges, from demographics to economic liberalization, China’s short-term efforts will produce results. At the same time, the European Union continues on its path to recovery. And as with the United States, both locations are benefiting from cheap commodity prices.
One simple sign of less stress in the global economy—the U.S. dollar is finally starting to soften a bit as panic that bit the markets earlier in the year continues to wane. It is now down about 6% from the peak it was at earlier in the year.
Market Outlook
As for the financial markets, they apparently have overcome much of the fear that dogged them earlier in the year. The S&P has more than recouped the losses experienced in January and February. At this point we should be used to such head fakes—this is the fourth time the market has seen a double-digit decline in values since the great recession came to an end.
This is a surprising degree of market volatility. In the past, typically, there has been only an occasional nonrecession market sell-off, Black Monday, for example, in October 1987. This is why we have economist Paul Samuelson’s immortal quip about the markets predicting nine of the last five recessions—in the last decade, the markets have gone five for one.
Why they are behaving so irrationally is impossible to know—although it may be worth speculating about the role of high speed trading, the weak pace of the U.S. recovery, or simply the psychology of being a trader in the post- Lehman failure world.
Whatever the reason, those monitoring the direction of the U.S. economy are best off ignoring the financial markets and focusing their attention on the “real” economy—since that is where recessions start in the first place. Beacon Economics’ nonheadline-making outlook is based on solid fundamentals for various segments of demand in the U.S. economy, which suggests continued growth.
California
For the fourth year in a row, California outpaced the nation in job growth as well as output. The state experienced broad-based gains across its key industries, ranging from agriculture to high tech and nearly everything in between, while its unemployment rate approached a multi-year low.
While the state is poised for continued growth in 2016, it also faces a number of challenges:
• First, as California’s economy has grown, housing affordability has once again emerged as a problem for households, both owners and renters.
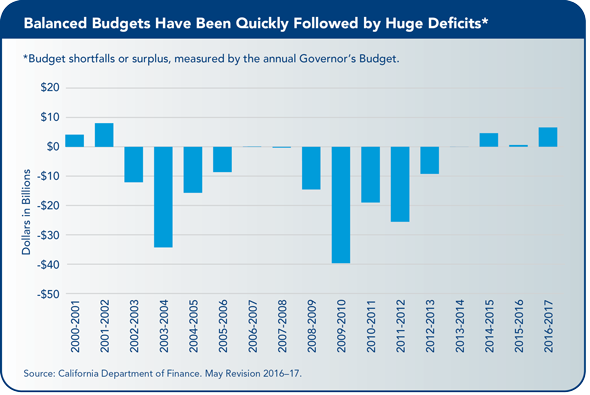
• Second, the state’s fiscal situation may have improved in recent years, but its budget is as vulnerable as ever to volatility in its revenues.
• Finally, like the nation as a whole, the gap between the haves and have-nots is cause for concern.
Gross State Output
The latest estimate of output for the state is for the third quarter of last year. From the same quarter of the previous year, overall output grew by 3.5% in California—almost twice as fast at the 1.8% seen in the balance of the nation.
Two sectors—professional and information—accounted for more than half of the output gap. These sectors include tech, but also a wide variety of other high-skilled sectors as well. Logistics, real estate and agriculture also out-performed.
The only sectors that were below national trends at a significant rate were finance, mining, manufacturing, and interestingly, government. Mining and manufacturing show the growing impact of environmental regulations and land costs in the state.
Government would seem to be a surprise given the bounce in state revenues. But like many governments across the United States, much of this funding is being siphoned off to back fill underfunded pensions and health benefits. As such, available resources for infrastructure and education have been more limited than what might be expected.
Labor Market
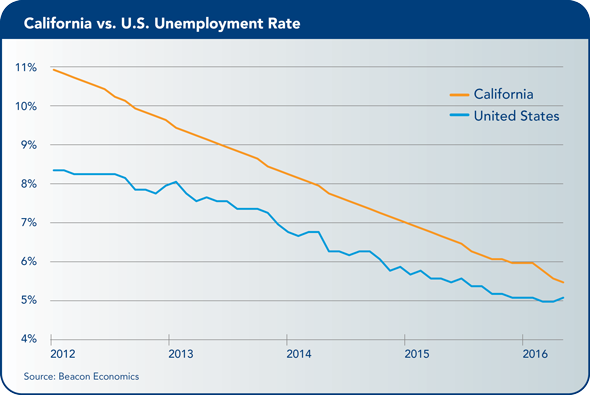
The closest thing to a real-time gauge of California’s economic performance is its labor market. As the state economy has chugged forward over the past three-and-a-half years, its unemployment rate has declined steadily. By the end of 2015, the unemployment rate stood at 5.9%, the lowest since late 2007, as job creation outpaced increases in the labor force.
For the fourth year in a row, California added wage and salary (nonfarm) jobs at a faster pace than the United States as a whole. California added jobs at an annual rate of 3%, well above the U.S. rate of 2.1% and the fourth fastest pace among the states. The pace of growth actually accelerated in 2015 to its fastest in more than 15 years.
Wage and salary employment increased by 466,000 jobs last year. Nearly every part of California— along the coast as well as inland—participated in that growth.
In yearly percentage terms, the San Francisco Bay Area and San Jose/Silicon Valley regions led the state in job gains, as they have over the last several years, with the Inland Empire and the Fresno Metro Area County turning in impressive increases as well. Los Angeles County led the state in absolute terms with more than 85,000 jobs added.
The start of 2016 has not looked good for California. If we are to believe the numbers as currently reported, job growth has slowed to barely 1% in the first three months, as a strong February was unable to make up for both a weak January and March.
The good news is that we don’t believe these numbers. Rather, we think that they are only showing issues with the survey used to estimate the numbers. Our reasons for this optimism come from a number of courses:
• One reason is the household numbers that have shown the exact opposite trend with an acceleration of job creation and the unemployment rate dropping by close to half a percent in just three months.
• The second reason is the odd nature of the declines. For example, administrative services shed 27,000 jobs from December to January alone, which single handedly accounted for the overall decline in the number of jobs.
Ultimately we think the revisions that come as the year progresses will show the situation in a more favorable light.
Real Estate Markets
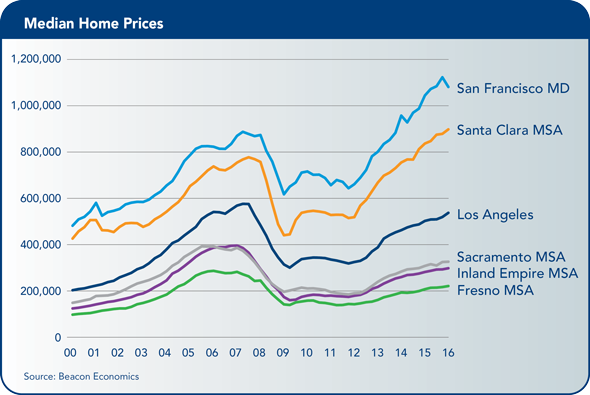
California’s housing market maintained an upward trajectory last year in terms of prices, sales, and new construction. The statewide median price of a home was $403,600 in the final quarter of 2015, an increase of 5.5% from one year earlier.
The statewide median has been on the rise consistently since 2012 but has yet to reach the peak of $519,800 that was set in the first quarter of 2007.
Similarly, sales rose last year by 10.5% following a decrease of 8.7% in 2014, but continue to be constrained by lean inventories in much of the state. Meanwhile, rental markets across the state were marked by low vacancy rates and rising rents last year, as the state’s homeownership rate (54.3%) showed little sign of improvement.
Higher home prices and sales ought to trigger an increase in construction, but new home building has been restrained in this cycle. In 2015, the total permits rose, but still fell short of the 100,000 threshold and were less than half of the peak levels that preceded the great recession. Moreover, multifamily permits accounted for the lion’s share of permits, mainly because much of the activity is taking place in the state’s large metro areas.
Part of the slow start is due to the high (and growing higher) cost of housing that magnifies the impact of credit constraints. But much more of it is due to the simple fact that permitting housing in the state takes years longer than most parts of the United States because of the political power that NIMBYs wield here.
Whatever the cause, California’s long-run housing and population imbalance is already starting to reappear—the state has added four new people for each new housing permit over the last two years, one of the lowest rates in the nation. This in turn is driving housing costs up to some of the highest in the nation.
Nonresidential real estate has shown considerable improvement in recent years. Vacancy rates on office properties have declined in many markets, while industrial real estate is in very short supply with vacancy rates among the lowest in the country. Lease rates for both property types have increased by varying amounts around the state, and should see further increases this year.
In turn, new commercial construction rose by 6.8% last year, a solid gain, but well below 2014 when valuations rose by nearly 40%. Increases in permit valuations occurred last year in hotels (+5.5%) and industrial (+0.6%), with retail declining by 5.6% and office down marginally.
Alterations also slipped, down 6.8%, after an increase of nearly one-third in 2014. The year ahead will be mixed once again, with retail and office under pressure, but continued gains anticipated in the hotel and industrial segments.
Conclusion
This year is shaping up to be one of steady gains in overall economic activity and employment, with the state’s key industries continuing to see job growth and the fortunes of California’s households improving with rising wages and growth in personal income. Despite concerns over the business climate, the state economy is one of the most dynamic in the country, as evidenced by the large amount of venture capital it has attracted on a consistent basis over the last several years.
The state is well-acquainted with the challenges it faces in 2016 and beyond. As the economy prospers, home prices shoot up and housing affordability plunges. Builders respond, but the incentives and constraints they face affect the mix of homes, leading to more higher-priced homes and an undersupply of lower-priced homes that the state needs. This story is not new, but rather is a recurring theme of California’s housing market.
Concern about California’s fiscal situation is yet another recurring theme in the state’s economic cycles. For years, the state’s revenue stream has been heavily dependent on the personal income tax, particularly taxes collected on those in the top tax bracket. Many in that bracket have high, but volatile, incomes that are tied to the performance of the stock market.
As such, the state’s revenues are especially pro-cyclical, rising sharply when the economy and financial markets are on the rise, but falling precipitously when the economy heads south.
 The California Chamber of Commerce Economic Advisory Council, made up of leading economists from the private and public sectors, presents a report each quarter to the CalChamber Board of Directors. This report was prepared by council chair Christopher Thornberg, founding partner of Beacon Economics, LLC.