California continues to enjoy strong overall economic growth, despite continuing challenges from the ongoing drought and global economic slowdown.
Nonfarm employment has averaged a 3.0% annual rate for the last three years, which is more than one and half times the pace of the rest of the country. The Golden State has added 482,000 net new jobs over the past year and the unemployment rate has fallen 1.2 percentage points to 6.3%. Growth continues to be broad based, with hiring being led by gains in the technology and life science sectors. Tourism is another bright spot and neither the stronger dollar nor slower economic growth overseas has yet to cut into the flow of international tourists into the state. Hollywood also is having a strong year, with box office receipts hitting new highs amid a flurry of blockbuster movies.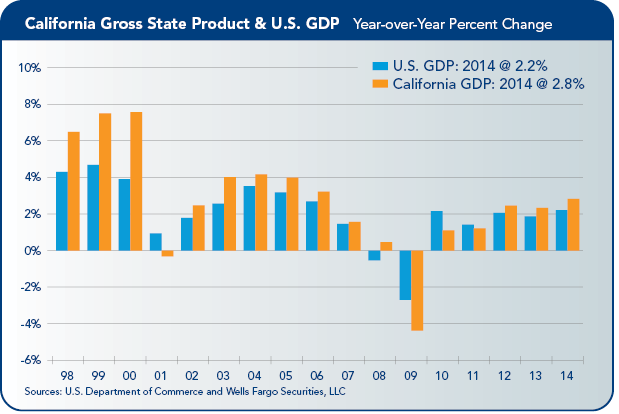
Economic Challenges
While California’s overall numbers remain strong, the state’s challenges are every bit as good as they were at the start of the year. With the exception of some brief rains earlier this summer, the drought remains unrelenting and has led to significant losses in the agriculture sector. The slowdown in China and much of the developing world has driven the value of the dollar much higher over the summer and also has raised questions about the viability of key export markets around the globe. The state’s high cost of living and greater regulatory burdens also are pushing more firms to relocate out of the state. Political fights over the minimum wage and affordable housing also add to the risks of doing business in California. Furthermore, the housing recovery remains spotty, with single-family construction still just a shadow of its previous norm and apartment construction mostly confined to higher-end projects.
So far, the rising tide of investment flowing into the state, made possible by the long period of exceptionally low interest rates, has more than offset these concerns, particularly in the state’s large metropolitan areas. Worries about equity valuations for biotechnology, life sciences, social media and information technology firms continue to increase, however, and some firms are beginning to retrench or at least curb their rate of expansion.
Hiring Remains on Fast Track
California businesses continue to add workers at a steady clip. Nonfarm employment rose 0.1% in June, as 22,900 nonfarm jobs were added across the state. Employment increased in most major industry categories and continues to be driven higher, primarily by strong gains in the state’s large information technology and life sciences sectors.
As such, the strongest job growth is coming from the Bay Area. The San Francisco metropolitan division added 2,400 jobs in June, which is the largest monthly gain in the state. Santa Rosa County added 2,000 jobs in June, while payrolls in San Jose-Sunnyvale-Santa Clara added 1,900 jobs and Oakland added 1,400 jobs during the month. Nonfarm employment in Vallejo and Napa both posted slight declines during the month.
State Unemployment
California’s unemployment rate fell 0.1 percentage point to 6.3% in June, marking a new cycle low, but the rate remains a percentage point above the national rate. California’s unemployment rate has remained above the national rate every month since April 1990, although the gap did narrow during the technology boom of the late 1990s.
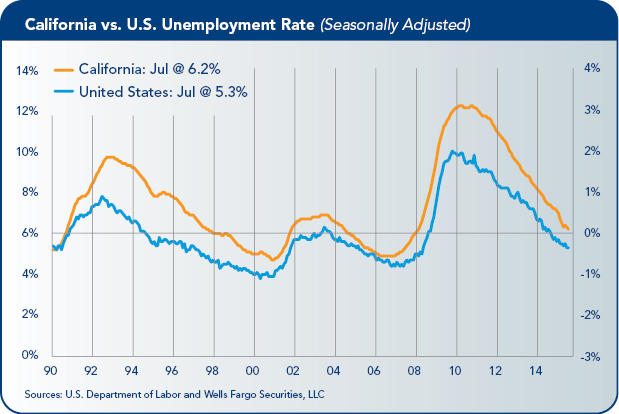 The current tech boom is having a similar effect on the unemployment rate and the gap between the Golden State and the nation has narrowed considerably over the past year.
California’s labor force participation rate has risen slightly over the past year, making it more difficult to reduce the unemployment rate. Total civilian employment in California has risen 2.7% over the past year, while the state’s labor force increased just 1.1%. Nationwide, total civilian employment rose 1.7% over the past year and the labor force grew just 0.5%. California’s stronger job growth is apparently pulling workers back into the workforce and also attracting job seekers from other parts of the country.
Most of the drop in the unemployment rate has been due to stronger job growth. The number of persons working in California, which is measured by the household survey, has risen by 2.8% over the past year, or 483,000 persons. Most of that increase has been in full-time work, which is defined as working 35 hours or more during the week. Full-time employment has risen by 3.2% or 432,000 workers, while the number of part-time workers rose by 2.7% or 93,000 persons. The number of Californians working part-time for economic reasons has fallen 7.9% over the past year, or by 96,000 persons.
Bay Area Employment
The lowest local unemployment rates are confined primarily to the Bay Area, which is the epicenter of the technology sector. San Mateo County boasts the lowest unemployment rate in the state in June, at 3.3%, followed closely by Marin and neighboring San Francisco counties, at 3.4% and 3.5%, respectively. Unemployment in Santa Clara County, home to the San Jose-Sunnyvale-Santa Clara metropolitan area, is currently just 4.0%, while the jobless rate to the East and North is only modestly higher. Alameda County’s jobless rate is currently 4.6%, while Contra Costa County has a jobless rate of 4.9%, and Napa and Sonoma counties come in at 4.1% and 4.3%, respectively. The only Bay Area county with an unemployment rate above the nation is Solano County, which currently stands at 5.9%.
Professional and business services account for the largest number of new jobs added over the past year, with hiring jumping 5.5% and 133,100 net new jobs added in the sector. Much of this gain has been in professional and technical services, which includes many high-tech occupations in both the information technology and life sciences industries. Employment in construction has posted the largest percentage gain, with hiring jumping 7.0% over the past year and 47,000 net new jobs added across the state. Construction employment remains only a fraction of its pre-recession level, however.
Southern California Employment
Employment conditions were generally soft throughout most of Southern California during June. Overall nonfarm employment declined by 3,700 jobs for the month but remains up solidly on a year-to-year basis. Most of June’s weakness was in Orange County, which lost 4,300 jobs in June. That marks the largest seasonally adjusted drop for Orange County since August 2009. Despite the drop, employment in Orange County remains 3.0% higher than its level a year ago, led by strong gains in construction, manufacturing, and professional and technical services. Unemployment also remains low. Orange County’s 4.3% unemployment rate is the lowest of any California county outside of the Bay Area.
The Los Angeles metropolitan division added just 900 jobs in June and the Inland Empire added just 800 jobs. Nonfarm payrolls in Ventura County rose by 700 jobs, while employment in Bakersfield fell by 200 jobs. All four areas show strong growth on a year-to-year basis and the seasonally adjusted data through the first six months of the year suggest that June’s soft readings may simply be some statistical payback for unusually strong gains earlier this year.
Data for the first half of 2015 show that the Los Angeles metropolitan division added nearly 100,000 net new jobs over the past year, or a gain of 2.4%. Employment in the Inland Empire rose 3.7%, a gain of 47,400 jobs, while Orange County added 45,800 new jobs, which translates into a 3.0% gain. Employment in Bakersfield and Ventura counties through the first half of 2015 is up 1.6% and 1.2%, respectively, from 2014.
The San Diego-Carlsbad metropolitan area lost 1,700 jobs in June, but has seen solid job growth over the past year. Nonfarm employment during the first half of 2015 is running 2.8% ahead of its pace from last year, producing a net gain of 35,700 new jobs. The San Diego area continues to enjoy exceptionally strong growth in life sciences, communications and new wearable technologies. June’s weakness appears to be tied to the end of the school year. Employment in state and local government and private education were notable weak spots during the month. San Diego’s tech sector does not show any signs of slowing. Employment in professional, scientific and technical services has risen 6.1% over the past year, accounting for about one-quarter of San Diego’s job growth. Construction and real estate are other notable bright spots and manufacturing has gotten a big boost from ship and boat building. Leisure and hospitality is another high growth area, with employment climbing 2.9% over the past year.
Unemployment rates have declined steadily across much of Southern California. Los Angeles County has seen its jobless rate dip 0.9 percentage points over the past year to 7.3%. While that rate appears relatively high compared to the 5.5% national rate, the unemployment rate has averaged 7.4% in Los Angeles since 2000. Moreover, the Los Angeles area has a large grey market economy that is not captured well in the official unemployment statistics.
Unemployment rates in surrounding counties have seen more pronounced declines. Orange County has seen its unemployment rate tumble 1.2 percentage points to 4.3%, while unemployment rates in Riverside and San Bernardino counties have both tumbled 1.6 percentage points to 6.6% and 6.5%, respectively. Ventura County has seen its unemployment rate fall 1.1 percentage points over the past year to 5.3%, which is even with the national average. The unemployment rate has fallen 1.4 percentage points over the past year in San Diego and is currently just 5.0%.
Tax Revenue
The Legislative Analyst’s Office reported that personal income tax (PIT) revenues in July were $130 million above the Governor’s projections for the month, compared to the estimate in the 2015–16 state budget plan that was passed in June. July income tax collections, which consist largely of withholding from employees’ paychecks, and gains in withholding, rose by more than 10% over their year-ago level. The surge in PIT payments was largely responsible for the positive revenue totals.
Sales and corporate taxes both were slightly below projections in July. Combined, “Big Three” General Fund tax collections are reported by the tax agencies to have been $75 million above the Governor’s projection for the month. July was the first month of the 2015–16 fiscal year. Agency cash collections for the 2014–15 fiscal year, which ended on June 30, also came in above expectations.
Trade
International trade, tourism and commercial construction have all gained momentum. Port activity has bounced back smartly following the disruptions at West Coast ports earlier this year and activity at inland distribution facilities has surged. Most of the improvement has been on the import side of the ledger, however, and exports have slowed in recent months.
 While West Coast ports have rebounded from the first quarter shutdown, the negative trends experienced during January and February have weighed on year-to-date growth for 2015. Activity has slowed in Los Angeles, California’s largest container port, as well as in Oakland. For the first seven months of 2015, overall volumes were down 3.5% in Los Angeles compared to the same period in 2014. Port of Los Angeles exports fell from 183,294 to 136,402 TEUs over the year in July, a 16.4% decline year-over-year. Container volume was down 6.3% in Oakland over the same period. The Port of Long Beach, however, experienced a 2.8% increase in volume in July, year-to-date.
California’s exports moderated somewhat in the first half of 2015. Exports fell a slight 0.9 percentage point year-over-year in the second quarter. On the bright side, the state has experienced gains in many of its strongest exporting sectors.
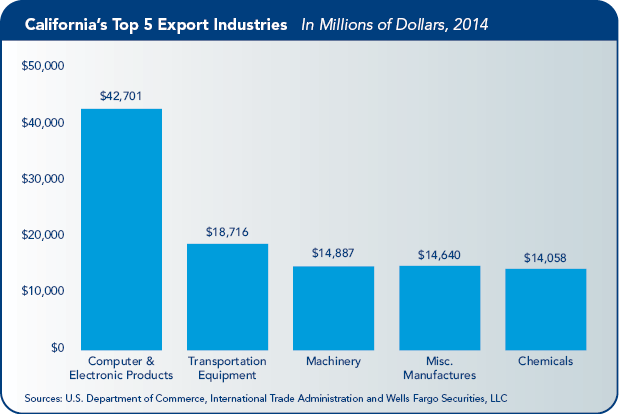
California’s greatest merchandise export category in 2014 was computer and electronic products, which increased 6.6% year-over-year in the second quarter. Additionally, computer and electronic products and transportation equipment are up 6.6% and 7.5%, year-to-year, respectively. Exports of chemical products are down 3.3% over the year. California agriculture exports totaled $3.5 billion in the second quarter and are up 5.7% year-to-year.
California greatly depends on international markets, as the state’s export shipments of merchandise totaled $173.8 billion in 2014. Mexico remains California’s largest export market with shipments totaling $25.4 billion, or 14.6% of the state’s total merchandise exports. Canada is the state’s second largest market, with shipments of $18.2 billion, followed by China ($16.1 billion), Japan ($12.3 billion) and Korea ($8.6 billion). The recent moderation in California’s export activity likely reflects the impacts of slower global economic growth and the rapid appreciation of the U.S. dollar.
Tourism
Tourism has surged this past year, as evidenced by increased airline deplanements, rising hotel occupancy rate and rising room rates. Both domestic and international tourist counts have risen during the past year, but most of the growth has come from the domestic side. More growth is on the way. Hotel construction has increased and Disney’s recent announcement of new attractions tied to its Star Wars franchise should fuel even more gains.
Hotel occupancy and revenue per available (RevPAR) room has risen across most major California regions. San Francisco and Los Angeles hotel occupancy has averaged 83.3% and 78.3% for the first half of 2015, respectively. In addition, RevPAR in San Francisco has risen steadily at 3.2% over the past year.
Airline passenger traffic though major California airports continues to increase. Domestic air traffic volume through the Los Angeles International Airport (LAX) through the first three months of 2015 is 5.0% above its year-ago pace. The San Francisco International Airport (SFO) has also seen a 4.1% increase in domestic air traffic through the first three months of this year, in comparison to last year. Passenger traffic is also up in San Diego, Oakland and San Jose airports.
The growth in airline traffic and increases in hotel occupancy and RevPAR has contributed to employment gains in California’s leisure and hospitality sector. For the first six months of the year, leisure and hospitality employment is up 3.8%, in comparison to the same time period in 2014.
Entertainment
On-location film production in Greater Los Angeles declined 1.9% in the second quarter of 2015 to 9,396 shoot days (SD), according to the latest research report from FilmLA. Despite the decrease in SD, television drama and Web-based TV production increased 12.3% and 34.0% over the year, respectively. Local on-location feature production rose a slight 0.4%, while commercial production slipped 7.3%. Furthermore, according to the recent 2015 Pilot Production report, California is currently home to 53 one-hour drama shows, the largest number in a single year since 2010. While the FilmLA report contains mixed results, the overall outlook for television production in the state remains optimistic. The new California film tax credit will help keep production in Los Angeles and is likely to spur growth in the industry as the next round of film credits takes effect.
Housing, Construction
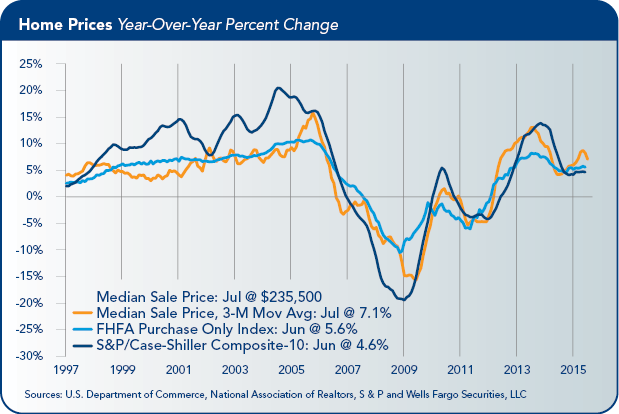
Housing remains a challenge for California and much of the nation. The influx of investor buyers earlier in the recovery propped up home prices, but at a considerable cost. The entrance of investor buyers pushed home prices up above any in the economy and put prices well ahead of incomes. This has created an even greater affordability hurdle for many first-time home buyers in a state where most people have to stretch to own a home.
 Land costs, development fees and construction costs also have ramped up considerably across the state, which has encouraged builders to focus almost solely on higher end projects. Much of the growth in housing permits has been in the apartment market, primarily in the Bay Area and Los Angeles. We are beginning to see a subtle shift back toward single-family construction and expect to see stronger gains in coming years.
Home sales strengthened in June and the outlook for sales growth remains positive as pending home sales increased for a seventh straight month in year-to-year growth. Sales of existing single-family homes rose 11.0% in June, reporting the first double-digit increase since May 2012. Pending home sales, which represent signed contracts that should close in the next 45 to 90 days, were up 12.5% on an annual basis. This marks the indicator’s fifth consecutive double-digit increase. Pending sales in the Southern California and Central Valley regions have improved significantly over the year, rising 13.6% and 12.3%, respectively. Pending sales have recently slipped in the San Francisco Bay Area, however, declining 7.2% over the month and 1.2% year-over-year. With overall pending home sales reporting double-digit gains, future home sales are likely to pick up in coming months.
Commercial construction has been building momentum for quite some time. The Bay Area was first out of the gate, with surging demand from tech firms driving office vacancy rates sharply lower and leading to a construction boom in San Francisco’s South of Market district. More recently, Southern California has come on strong, with several major office projects underway in downtown Los Angeles and leasing activity picking up in most key submarkets.
Demand for industrial space also has ramped up, particularly in the Inland Empire. The retail market remains somewhat spotty. Vacancy rates have fallen modestly, but demand continues to be siphoned away from online retailers. Despite this trend, and California’s more tech-savvy population, the Golden State’s retail market is generally stronger than the nation’s as a whole.
Agriculture
On an overall basis, California’s agricultural sector has remained remarkably resilient to the ongoing drought, which has now been running for at least four years. Recent research from the University of California, Davis put 2015 losses at $2.7 billion, with crop losses totaling $900 million, dairy and livestock revenue losses at $350 million and the additional cost of pumping water at $590 million. Direct job losses in the farm sector are estimated to be 10,100 jobs. The $1.84 billion in direct losses translates into a total loss of $2.7 billion once put through an input-output matrix that produces widely used add-on, or multiplier effects.
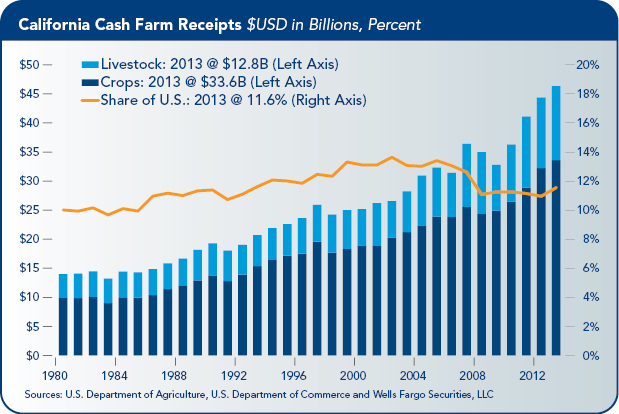 For perspective, California’s nominal gross domestic product (GDP) totaled $2.203 trillion in 2014, which is the latest data available. That puts 2015 drought-related losses at around just 0.1% of California’s GDP, using a conservative estimate for current year GDP growth.
The small relative loss to California’s GDP is somewhat misleading. The technology sector has been booming and has made a huge contribution to the state’s strong economic performance. While in the aggregate those gains offset losses elsewhere, the gains in Silicon Valley provide little or no relief to farmers who have idled land in the Tulare Basin or ranchers and dairy farmers who are paying more for hay and silage. Few workers displaced in agriculture are likely to land at the next tech startup. In short, to those experiencing losses, the losses are very significant.
California has been able to manage its way through the drought so far by tapping groundwater from deep underground aquifers. Groundwater has offset much of the surface water shortage. But groundwater substitution is not a long-term fix. Farmers are digging deeper and deeper to tap adequate water resources, which drives up costs. There also are long-term environmental costs to pulling water from aquifers. For land where groundwater substitution is not an option, farmers are either purchasing water, tapping limited amounts of water from waterways, or taking land out of production. The latest UC Davis study shows that 540,000 acres have been fallowed, which is nearly 20% higher than one year ago. The scarcity of water has caused farmers to push further up the value chain and concentrate on higher-value crops. Processing tomato contracts have shifted north from the San Joaquin Valley to the Sacramento Valley, and rice acreage has been reduced.
Almond and walnut acreage has increased dramatically over the last five years, with UC Davis estimating that more than 200,000 acres have been diverted from some other crop. Most of this newly planted acreage was previously growing cotton, grains, hay or was irrigated pasture land. Young orchards generally require less water than many of the field crops that they replace. The move to grow more nuts, however, was driven largely by market forces, namely growing demand from China and the growing popularity of nuts as a source of protein in low carbohydrate diets.
There has been a great deal of discussion about a strong El Niño building in the Pacific that should finally bring some relief to California and the Sierra mountains this winter. The latest weather forecast from the National Oceanic and Atmospheric Administration does foresee any dramatic changes in weather patterns, however. Another year of drought would bring significantly greater challenges to the state’s agriculture sector. The cost of drilling for groundwater increases each year as wells need to be drilled deeper. In addition, water transfers from the Sacramento River may need to be curtailed if water temperatures at the Shasta Reservoir are not cool enough to support fish.
The drought is not the only issue facing the state’s farmers. Dairy farmers, which account for the largest single source of farm revenue, are getting squeezed from lower prices and weakening export demand. The recent devaluation of the yuan and resulting declines in emerging-market currencies and currencies of commodity-producing countries will add to these pricing woes. In addition, the cost of hay and silage remains high.
The drought has cut into almond production. The average nut set per tree is 5,874, which is down 12% from the 2014 almond crop. The Nonpareil average nut set is 5,239, down 14% from last year. The average kernel weight for all varieties sampled was 1.43 grams, down 1% from 2014. The California Almond objective forecast for 2015–2016, which was announced July 1, calls for 1.8 billion meat pounds of California almonds to be harvested this year, down from an estimate of 1.85 billion meat pounds projected back in May and the 1.87 billion pounds reported to have been harvested in the 2014–2015 season.
Estimates for this year’s walnut crop are not yet available, but orchards appear healthy. California’s pistachio crop looks as though it will be significantly lower due to a lack of chilling hours, water shortage and poor water quality. Early estimates put the harvest down as much as 70% from last year.
Fruit orchards are seeing modest declines. California’s peach crop is expected to total 559,000 tons, which would be down 10% from last year. California’s navel orange harvest comes in at 79 million cartons, down 1% from the previous forecast, but up 2% from last year. Valencia orange production totaled 19 million cartons, which was down 5% from the previous forecast and off 11% from last year’s final figure.
Rice production is projected to total 31.9 million hundredweight, down 14% from 2014. Production of alfalfa hay is expected to decline 21%. The volume of corn harvested for grain is expected to be down 25%. Production of Upland cotton is expected to total 180,000 bales, a decrease of 16% from last year. Production of American Pima cotton will likely fall 30% to 350,000 bales.
Wine grape production will rise this year. The latest forecast calls for a harvest of 4 million tons, which would be 3% greater than last year’s crop. California raisin grape production is expected to rise 13% this year to 2 million tons and production of table grapes is expected to rise 3% to 1.2 million tons.

The California Chamber of Commerce Economic Advisory Council, made up of leading economists from the private and public sectors, presents a report each quarter to the CalChamber Board of Directors. This report was prepared by council chair Mark Vitner, managing director and senior economist at Wells Fargo Securities, LLC .
Publication of this report is a project of the California Foundation for Commerce and Education.
![]()