 California’s economy appears to be maintaining strong momentum through the first few months of 2015, even though the state’s economy continues to be impacted by a whole host of challenges, ranging from the unending drought to the work stoppages at major port facilities earlier this year. The soaring value of the U.S. dollar, and slowing economies in China and much of the developing world are also weighing on growth.
Despite these challenges, most measures of economic activity show California’s economy continues to charge ahead. The Golden State has added close to half a million net new jobs over the last year and the unemployment rate has tumbled 1.4 percentage points to 6.5%. Income growth also has picked up, with personal income climbing 4.8% in 2014 and state tax receipts running well ahead of expectations.
The Golden State’s strong economic performance comes as a surprise to much of the nation, which continues to be fed a seemingly endless stream of negative feedback on the state. While California faces considerable challenges, businesses have been adding jobs at a faster pace in the state than they have nationwide for the last 36 months. New business startups have also continued to trend higher and venture capital continues to flow into the state in greater quantities than anyplace else on Earth.
None of this minimizes the damage that the fourth year of drought has brought to the state. More than 400,000 acres of some of the most productive farmland in the world have been fallowed and new water use restrictions have been put in place around the state. The drought also has garnered considerable headlines, leading to heightened concerns around the country from those that do business in the state.
Ports
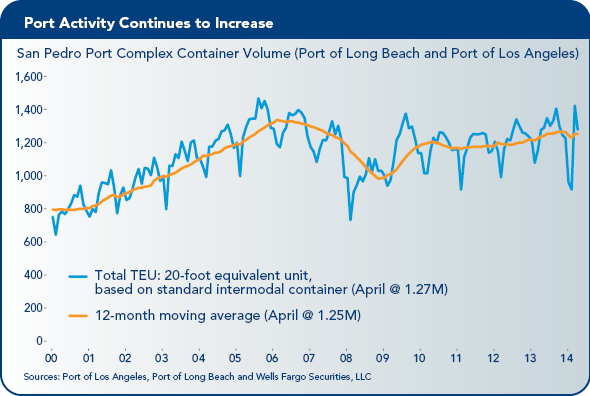
The port shutdown over President’s Day weekend, and the slowdown that preceded it, also took a toll on growth earlier this year. The volume of containers loaded through the San Pedro Port Complex was down 18.2% on a year-to-date basis through February.
Fortunately, the labor dispute was resolved and activity at the port surged back in March. Container traffic through the Port of Los Angeles spiked to a 17.3% year-to-year gain in March, which pulled the year-to-date number back to just a 5% decline.
Port traffic through the Port of Long Beach also jumped in March and is now down just 3.3% on a year-to-date basis over the past year after being down almost 20% the prior month.
Container traffic through the Port of Oakland also rebounded in March.
The rebound in port traffic has reverberated throughout port-related businesses, leading to a spurt in hiring in transportation and warehousing. The bulk of the impact has been felt in the Inland Empire, where many of the goods imported through Southern California ports are resorted and shipped. While the port stoppage is behind us, a smaller strike at independent trucking firms has slowed the processing of some items and kept the issue of labor disputes in the spotlight.
Hiring Remains on Fast Track
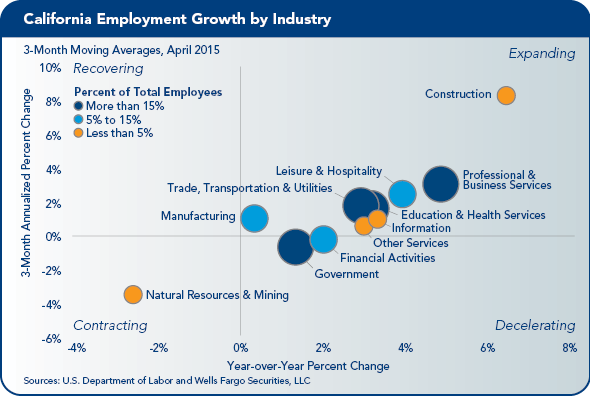
California continues to add jobs at a rapid clip. Nonfarm payrolls increased by 39,800 in March, with solid gains across most major industries.
As has been the case throughout the recovery, employment growth is being led by hiring in California’s technology sector. Employment in professional, scientific and technical services rose 0.8% in March, and is up 6.4% year over year. This lone tech subsector has added 72,100 jobs over the last year, accounting for 15% of the 481,900 nonfarm jobs added statewide.
Hiring also has risen sharply in other areas of the tech sector, including data processing, software publishing and Internet search. Job growth in the tech sector directly, and indirectly, supports employment gains in other areas, including administrative and support positions, construction, and wholesale trade and distribution.
Construction payrolls also posted a large gain in March, climbing a full percentage point or 7,300 positions. Construction employment has risen 6.9% over the last year, reflecting a gain of 46,300 new jobs. About two-thirds of that gain has been at specialty contractors, with the remainder coming from the construction of buildings.
Of the growth in the latter category, about half has come from residential and half from nonresidential structures. Construction payrolls in California remain a shadow of where they were prior to the crash, accounting for just 4.5% of nonfarm payrolls compared to its most recent peak of 6.3% back in early 2006.
Transportation and warehousing also posted a sizable job gain, with payrolls rising a full percentage point in March, when 5,300 net new jobs were created.
March’s gain likely reflects a rebound in port traffic since the agreement to settle the West Coast ports labor dispute. Traffic through the ports of Los Angeles and Long Beach surged in March, which likely boosted demand at trucking firms, warehouses and other related businesses.
Trucking and warehousing has been a growing industry in California for some time, adding 24,900 jobs over the last year, or a 5.6% gain.
Unemployment Rate
California’s unemployment rate fell 0.2 percentage points to 6.5% in March, marking a new cycle low. The Golden State’s unemployment rate has fallen 1.4 percentage points over the past year, compared to a 1.1 percentage point drop nationwide. The larger drop in California is primarily due to stronger job growth.
Total civilian employment in California has risen 2.7% over the last year, while the state’s labor force increased just 1.1%. Nationwide, total civilian employment rose 1.7% over the past year and the labor force grew just 0.5%. California’s stronger job growth is apparently pulling workers back into the workforce and also attracting job seekers from other parts of the country.
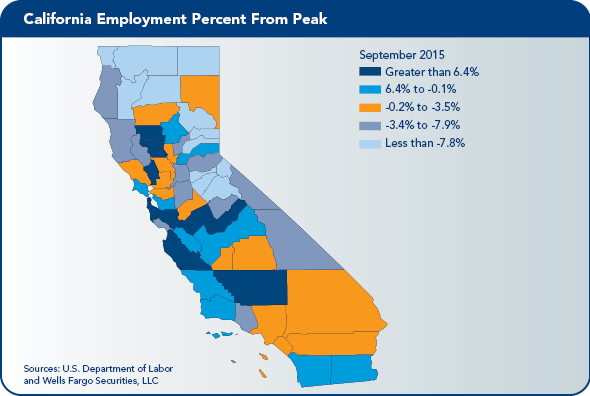
San Francisco Bay Area
Among metropolitan areas, the lowest unemployment rates continue to be found in the San Francisco Bay Area, where years of strong employment growth have driven the jobless rate in San Francisco to below 4%. San Mateo County had the lowest unemployment rate in March at just 3.4%, followed closely by Marin County at 3.5%.
Unemployment rates also have fallen sharply in most other parts of the Bay Area. San Jose’s unemployment rate has fallen 2 percentage points over the past year to 4.2%, while the jobless rate in Oakland has fallen 1.8 percentage points to 4.9%. Jobless rates also have fallen sharply in Napa and Sonoma counties, tumbling 1.8 and 1.7 percentage points, respectively, over the past year.
The improvement in employment conditions is still most apparent in areas closest to California’s largest metropolitan areas. The outer reaches of the Bay Area and Central Valley are improving, but most of these areas are still enduring relatively high unemployment rates.
Southern California
Although Southern California has not quite matched the Bay Area’s gains, employment conditions have improved considerably. Nonfarm employment in Los Angeles has surged 2.7% over the past year, producing a gain of 113,300 new jobs.
Hiring rose even more dramatically in the Inland Empire, with nonfarm payrolls surging 4.2% over the last year. A large part of that gain has been in the trucking and warehousing sector.
Orange County also has seen strong gains and the unemployment rate has tumbled 1.4 percentage points over the past year to just 4.4%. Hiring in Ventura County has risen less dramatically, climbing just 1.7% over the last year. That gain, however, is still roughly in line with the national rate. Moreover, the unemployment rate has tumbled 1.7 percentage points over the past year to just 5.4%.
San Diego continues to see strong gains, with nonfarm payrolls rising 3.1% over the past year and 40,900 net new jobs created across the metro area. Overall job growth continues to be driven by gains in the region’s burgeoning life sciences and technology sector. Hiring in professional and technical services has surged 7.2% over the last year, producing a net gain of 9,100 new jobs.
Unemployment rates have declined steadily across much of Southern California. Los Angeles County has seen its jobless rate dip 1.3 percentage points over the past year to 7.2%. While that rate appears relatively high compared to the 5.4% national rate, the unemployment rate has averaged 8% in Los Angeles since 2000. Moreover, the Los Angeles area has a large grey market economy that is not captured well in the official unemployment statistics.
Unemployment rates in surrounding counties have seen more pronounced declines. Orange County has seen its unemployment rate tumble 1.2 percentage points to 4.4%, while unemployment rates in Riverside and San Bernardino counties have tumbled 2.2 percentage points and 1.7 percentage points to 6.7% and 6.5%, respectively.
Ventura County and San Diego County have both seen their jobless rates fall below the national average, with the unemployment rate falling 1.7 percentage points in Ventura and 2 percentage points in San Diego over the past year.
Surge in Tax Revenue
The Franchise Tax Board provided preliminary reports for April personal income tax (PIT) and corporate tax collections (CT), which both show strong growth. Combined, the two taxes are running $1.8 billion above projections, with most of the upside surprise coming from personal income tax collection.
The PIT ended April more than $1.7 billion above the most recent administration projections, while the CT topped expectations by $86 million. PIT withholdings increased 15.3% year-over-year, which suggests that employment, hours worked and wages have also risen solidly over the last year. Payments on 2014 final returns were up 20.7% from last April, while 2014 extension payments exceeded $5 billion, a 23% gain from the prior year.
This year’s large increase in final returns likely reflects increased capital gains, bonus, and option income. Gains are being fueled by the strength in the state’s technology and life sciences industries, the influx of venture capital and private equity and a strong stock market in general.
The strength in April final returns is typically a good sign for the rest of the year. June PIT collections are largely quarterly estimated payments by high-income taxpayers on 2015 income. The Franchise Tax Board monthly data shows estimated tax payments totaled $2.65 billion in April 2015, which was $387 million higher than the prior year, a 17.1% increase.
The current administration forecast projects that June 2015 estimated payments will fall 4.7% from the prior year. If June 2015 estimated payments are up by the same 17.1% they were in April, this would put estimated payments $1.2 billion ahead of current projections. Both the administration and Franchise Tax Board released revised revenue and budget estimates in mid-May.
Port Activity Bounces Back
The West Coast port slowdown and shutdown over President’s Day weekend led to significant disruptions during the first quarter. Exporters generally had to find other shipping alternatives, including ports in Texas and the East Coast, as well as air freight. Imports were largely stuck at sea, although some shipments had already been diverted well ahead of February’s shutdown.
Port traffic plunged in February and surged back in March. Most of the rebound, however, was inbound traffic. There was less of a backup of exports and many ships were reloaded with largely empty containers.
Conditions are rapidly returning to normal. Port activity through the first three months of this year is running 5.4% below last year in California’s three largest container ports (Los Angeles, Long Beach and Oakland) after incurring the huge monthly swings in container shipments during those months.
Activity at trucking firms and warehouses also has bounced back and attention is now refocusing on longer term drivers of trade, such as economic conditions in China, Japan and emerging Asia, as well as growth prospects for Mexico and Latin America.
State Exports
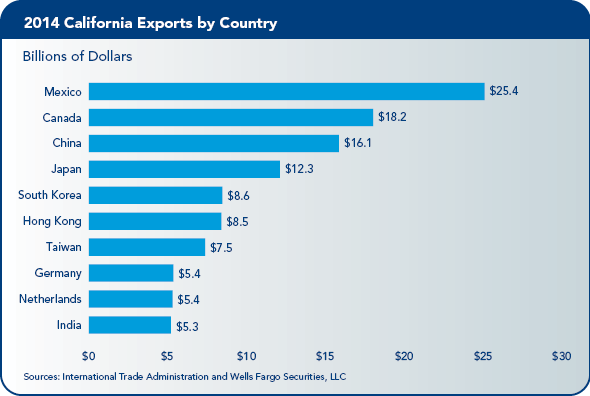
California exports rose 3.6% in 2014 to $174.1 billion. Computers and electronic components accounted for $42.7 billion of California’s total merchandise exports, or 24.5% of the total. Other major merchandise exports include transportation equipment, which totaled $18.7 billion; nonelectrical machinery, $14.9 billion; miscellaneous manufactures, $14.6 billion; and chemicals, $14 billion. California agricultural exports totaled $13.6 billion in 2014, a drop of 1.3%.
Mexico remains California’s largest export market, with $25.4 billion of the state’s merchandise exports headed there. Canada ranks as California’s second largest market, with shipments of $18.2 billion, followed by China, $16.1 billion; Japan, $12.3 billion; and Korea, $8.6 billion.
Trade with the 20 nations currently covered by free trade agreements accounted for 40% of California’s exports in 2014. Since 2005, exports to these markets grew by 50%, with North American Free Trade Agreement (FTA) countries, Korea, Chile, Dominican Republic-Central America FTA countries, and Australia showing the largest dollar increases.
Return of Bubble Talk
The question of whether social media, life sciences and California’s housing market are back in bubble territory has seen renewed emphasis in recent months. The common thread weaving these industries together is low interest rates, both in the U.S. and around the world.
The hunt for yield has led to a surge in demand for alternative assets, which has fueled a private equity boom and enabled many start-ups to rapidly achieve stratospheric valuations. The housing market also has been impacted, as institutional investors and private investors have bought up many of the lower-priced homes in California and converted them to rental properties. These properties are, for the most part, off the market, which has reduced housing turnover and substantially reduced inventories in certain segments of the market.
Social media equity valuations have come under some pressure recently. Determining where to draw the line between a boom and bubble has always been difficult in real time. Yet it is difficult to ignore the similarities with previous market tops.
The CNBC television network established a San Francisco bureau on Market Street the very same week Twitter and Yelp reported disappointing earnings. Both firms were early pioneers in the movement of tech firms into downtown San Francisco and were instrumental in establishing the South of Market district (SOMA) as a home for burgeoning tech firms.
Federal Reserve Board Chair Janet Yellen also has made comments concerning equity valuations and credit spreads, noting that “equity market valuations at this point generally are quite high.” The remarks follow more pointed concerns raised last year about social media stocks and life sciences companies.
Yellen also very clearly stated her concerns about credit spreads, saying, “We’ve also seen the compression of spreads on high-yield debt, which certainly looks like a reach of yield type of behavior.”
While it might appear to some that these are off-the-cuff remarks, Yellen’s most recent comments were made in response to a question from International Monetary Fund Managing Director Christine Lagarde. The comments also came on a day when Alexion Pharmaceuticals agreed to pay more than 120% premium for Synageva BioPharma, which is one of the largest premiums ever paid by a drug firm. While even Yellen was reluctant to say that we are already in a bubble, takeover valuations are clearly frothy.
Froth also is apparent in the housing market. Eight of the top 15 housing markets, as identified by the National Association of Realtors, are in California. Home price appreciation, which had been decelerating late last year, has picked back up.
Statewide prices have risen 6.3% from March 2014 to March 2015. Home prices in the San Francisco Bay Area are up 12.8% year-to-year over this same period, while prices have risen 6.7% in Los Angeles and 4.1% in the Inland Empire.
While there are increasing reports of bidding wars for homes in some widely sought out submarkets, the only metro area where homes are consistently selling above asking prices is the San Francisco Bay Area, specifically homes in San Francisco, San Mateo and Santa Clara counties.
Housing clearly is expensive relative to rents, with a home price-to-rent ratio of 1.68 in San Francisco and 1.60 in Los Angeles. By comparison, the home price-to-rent peaked at around 2.30 in both metro areas at the height of the housing bubble and bottomed out at around 1.20 in the midst of the housing bust in 2009.
Strengthening Home Sales
Home sales picked up solidly in March and rising pending home sales data suggests that sales will strengthen further this spring. Sales in March were up 6.3% from a revised 368,400-unit pace in February and were up 7.3% from a revised 365,120-unit pace in March 2014.
March marks the first back-to-back year-over-year sales gain since December 2012 and the largest year-over-year gain since May 2012. Pending home sales, which represent signed contracts that should close in the next 45 to 90 days, rose 16.3% in March and are up 13.8% on a year-to-year basis. The yearly increase is the second largest since April 2009 and marks the fourth consecutive month of year-to-year gains.
Pending sales are up solidly across the state, climbing 15.3% in the Central Valley, 15% in Southern California and 7.2% in the inventory-constrained Bay Area.
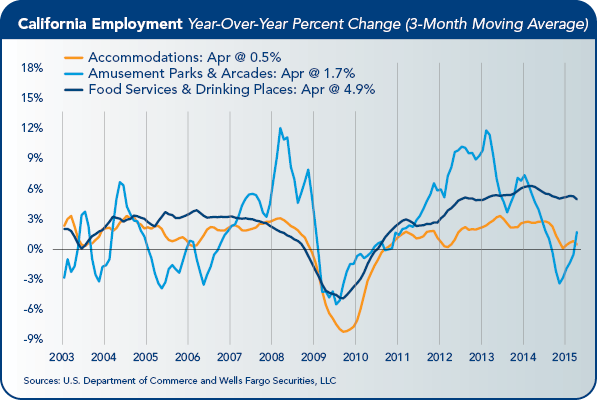
Tourism
Travel and leisure continues to show strong growth from a demand standpoint. Hotel occupancy and revenue per available (RevPAR) room increased across most major California markets, and occupancy rates are near historic highs in San Francisco and Los Angeles.
Airline passenger traffic through major California airports continues to rise solidly. Domestic passenger traffic through LAX through the first three months of 2015 is running 2.1% ahead of its year-ago pace and international traffic is up 4.2%. San Francisco International Airport has seen domestic travel increase 4.6% through the first three months of this year and international travel has risen 4.7%. Passenger traffic is also up solidly in San Diego, Orange County, Oakland and San Jose.
Despite the growth in airline traffic and gains in hotel occupancy and RevPAR, employment in the leisure and hospitality industry has actually grown more slowly in recent months. Part of the slowdown may be due to hikes in the minimum wage at the local level. Earlier employment figures may also have been bolstered by efforts by some employers to reduce hours for part-time workers.
Entertainment
On-location film production days in Greater Los Angeles fell 3.1% in the first quarter of 2015 to 8,707 shoot days, down from 8,982 a year earlier, according to data compiled by FilmLA. The first quarter recent report illustrates how much Los Angeles feature production levels are tied to the availability of California state film incentives.
Regional feature production declined 15.4% to 926 shoot days in the first quarter of 2015 from the same quarter last year. Feature film projects that qualified for the California State Film and Tax Credit Program in 2014 generated 42 shoot days in the first quarter. Without these projects, feature production would have fallen more than 19%.
On-location television production, which is also supported by state incentives, rose 1.7% in the first quarter.
Growth in TV drama and reality TV, up 29.7% and 19.8%, respectively, offset declines in TV pilots, which fell 19.4%; TV sitcoms, which fell 14.8%; and Web-based TV, which fell 12.2%.
Agriculture
California’s agriculture sector continues to struggle with drought, sluggish global economic growth and fluctuations in the value of the dollar. Farmers continue to get squeezed by higher operating costs and low prices.
Dairies are coping with reduced demand from China and higher prices for hay and silage. Lower corn prices will help offset some of these costs, however, and dairies enjoyed pretty good pricing in 2014, leaving them in relatively good shape going into 2015.
Prices for feeder and fed cattle are down slightly from their recent highs. Feeders are also benefiting from lower corn prices. December’s rains improved grazing conditions, benefiting cattle operators earlier this year.
Fruit and Nuts
Fruit and nut producers are holding up well considering the pressures they face from the drought. There was relatively little freeze damage in the Central Valley this past year. The sizing of citrus fruit has generally been smaller, however, likely due to the drought. Citrus and stone fruit growers on the east side of the San Joaquin Valley are especially concerned about water supplies and the performance of their wells closer to the foothills.
Almond and pistachio growers expect yields to fall this year, due to poor irrigation and a lack of dormancy. Pistachio and almond prices remain near record highs, however, which is encouraging even more planting. Almond prices may rise further if this year’s crop comes in smaller again. Pistachio prices also are expected to strengthen and Iran has reportedly sold off its large crop. Walnuts are still selling at some of their highest prices ever, but sales to China have slowed considerably and the stronger dollar may cut further into sales.
Wine Grapes
California’s wine grape sector has seen good harvest the last few years. The 2014 wine grape harvest was 3.9 million tons, slightly below the record crop from the prior year. The large back-to-back harvests have put downward pressure on spot prices. Demand remains strong, however, which has help growers secure contracts for 2015 and will reduce the risks to wineries.
 The California Chamber of Commerce Economic Advisory Council, made up of leading economists from the private and public sectors, presents a report each quarter to the CalChamber Board of Directors. This report was prepared by council chair Mark Vitner, managing director and senior economist at Wells Fargo Securities, LLC.
Publication of this report is a project of the California Foundation for Commerce and Education.
![]()