U.S.: Glass Still Half Full
Worries about the U.S. economy have dominated news headlines since the start of 2016. There was weak headline growth in the 4th quarter of 2015, industrial production is falling, the global economy—particularly the BRIC nations (Brazil, Russia, India, China)—seems to be floundering, and commodity prices keep dropping.
These worries appear to have spooked the financial markets leading to a broad selloff in the stock market—the market is off 10% from where it was at the end of last year.
High-yield credit markets also are taking a beating and even bank sentiment is turning somewhat. Taken together, it may look like an economy that has lost the momentum it started to build early in 2015.
However, if you put the screaming headlines to one side and take a closer look at the data, it turns out that things are really no worse now than they were one year ago. While there are clearly issues that continue to interfere with the U.S. economy’s ability to get past a 3% pace of growth, on the other side of the equation, there are plenty of positive indicators suggesting that, at worst, 2016 will see growth remain in the 2% to 2.5% range.
The stock market selloff seems to fly in the face of the idea that the markets are forward looking—whereas many other indicators of economic growth, such as employment, are inherently backwards looking.
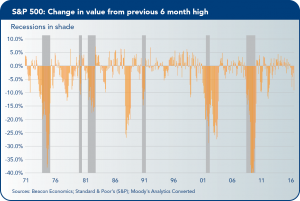
But the idea that the markets are forward looking couldn’t be farther from the truth. The chart above shows the history of stock market selloffs, as measured by the difference in the current value of the market relative to the high of the previous 12 months.
The last 50 years are littered with equity selloffs of larger magnitudes than this current episode—and without any broad economic impact. As economist Paul Samuelson famously quipped, the markets have correctly predicted 9 of the last 5 downturns.
If we look at the fundamentals of the U.S. economy, they continue to improve at a steady pace despite turmoil in the commodity markets and issues in the global economy. With the notable exception of mining and minerals, there is no part of the economy that is seeing any substantial slowing of activity—and there is little sign that there are any dangerous imbalances forming in the system that could cause a future slowing.
Quarterly Growth
The 2015 4th quarter advanced estimate of growth came in at a weak 0.7%, driven by weak numbers for business investment, trade, and inventories. We expect the estimate to be revised up modestly in the next revision.
Average quarterly growth for the year was 1.8%, down from last year’s 2.5%. But growth in gross output isn’t the best indicator of the economy’s health—growth in final demand is. And, as it turns out, businesses, consumers, and the government increased their spending in 2015 by close to 3% per quarter—on par with 2014 and better than 2013 by a good margin. Overall, final demand grew at an average pace of 2.5% in 2015—down only slightly from 3% in 2014, but quite a bit above 2013’s pace of 1.5%.
Consumer Spending
Consumer spending is a particularly bright spot, being given a lift by a strong labor market, slightly easier access to credit, weak inflation figures, and improved balance sheets as a result of the real estate recovery. While the nominal retail sales figures grew at a weak 1% year-on-year pace in the last quarter of 2015, this was a price rather than quantity phenomena.
Real spending on goods was growing at close to a 4% year-on-year pace at the end of the year with the domestic auto sector seeing a record number of sales.
Growth in spending on services did slow at the end of the year, but this was driven largely by utilities (due to the mild fall weather) and health care spending. What wasn’t spent was added to consumer savings—that rate rose to 5.4% by the end of 2015, up from 4.6% at the end of 2014.
Job Markets
Despite issues surrounding commodities and exports, the job markets are chugging forward with almost 900,000 new positions added in the last three months of the year in a variety of sectors. The retail industry overall saw solid numbers despite ongoing pressure on traditional brick-and-mortar stores (online and nontraditional retail more than made up the difference).
Even manufacturing saw positive (if small) employment gains despite the glum outlook. Headline unemployment is below 5% and the broader measure of unemployment, the U6 [includes workers who are part-time for economic reasons], is at 9.9% as of January. This is down from 11.3% last January.
Industrial Economy
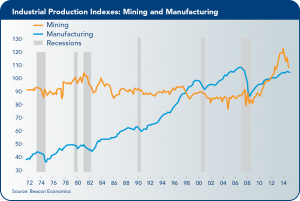
On the industrial side of the economy, things are doing fairly well despite weak numbers out of the ISM (Institute of Supply Management) index. Overall manufacturing output is up 1% from last year—weak but still in positive territory.
Most of the turmoil and the decline in industrial production has been based on a sharp slowing in the mining sector. Most other sectors are fine or even thriving—such as autos, airplanes, and electronics.
As for mining itself, the sector represents less than 2% of the U.S. economy and less than one-half a percent of employment. This can cause turmoil in some areas, but simply isn’t broad-based enough to do more than create modest headwinds for the economy.
History backs up this mild view: A similar collapse occurred in the mid-1980s and late-1990s and it neither sank the U.S. economic expansion nor created any sort of major manufacturing retraction.
Housing
The housing market continues to move slowly forward. Single-family construction starts rose to close to an 800,000 annualized pace at the end of 2016—still weak from a long-term standpoint but the best since 2007.
And the outlook for 2016 is much improved. Mortgage debt is finally expanding, household formation is picking up, and overall housing vacancies are down. With home affordability still relatively good, 2016 should see rising home ownership levels, more construction activity, and steady price appreciation.
International Trade
The trade deficit widened through 2015—although this is not because of falling exports. Overall export volumes stayed steady through the year in real terms despite the high value of the dollar. This is because U.S. producers tend to price in local currencies rather than in U.S. dollars given the highly competitive nature of international trade. The impact is not jobs but profits.
Imports have been growing sharply through the year, driven by strong domestic consumer demand.
Financial
And despite recent wobbles in the equity markets, in reality, the financial state of the U.S. economy is solid. Debt levels are steady and asset prices remain reasonable, given low interest rates.
While Wall Street worries about some downward pressures on corporate profits, the financial fundamentals (debt to equity ratios for example) for most sectors of the economy look very good. Interest rates have stayed low despite the Fed raising the Funds Rate in December.
And in the end, the global savings glut will continue to put profound downward pressure on rates regardless of Fed policy.
State Still Outpacing Nation
Given all the negative rhetoric aimed at the state over the past decade, California has a lot to crow about. In the last four years, the state has accelerated to become one of the fastest growing in the nation. Consider the recent data:
Jobs
California has added almost 900,000 jobs in the last two years—almost twice as many as the slowing, oil-dependent Texas economy. The last quarter of 2015 did not disappoint with more than 108,000 jobs added in the state.
Top sectors for growth included hospitality (23,000), administrative (19,000), construction (18,500), retail (16,000) and professional (13,000). Unemployment is below 6%—rapidly re-converging with national levels.
Regional Patterns
The regional patterns of job growth shifted a bit toward the end of the year—although we caution against reading too much into late year estimates given the sometimes sharp revisions that occur when new benchmarks are released in March.
• Los Angeles added the most jobs (22,000), but was running at a slower pace than the state overall at 2.1%.
• San Jose and San Francisco both continued to grow faster than the state as a whole, with San Jose adding more than 10,000 jobs at the end of the year, a 4% pace.
• San Diego and Orange counties slowed toward the end of the year, adding 7,900 and 6,100 jobs, respectively.
• Inland areas also have shown some solid growth rates. The Inland Empire added more than 14,000 jobs in the last three months—a faster growth rate than San Jose.
• The East Bay added close to 10,000 jobs as more firms look to the other side of the Bay for more affordable real estate.
• Kern County also posted some solid gains after a weak year, driven by the oil situation.
• Stockton and Sacramento both grew rapidly at the end of the year, posting 4.3% and 2.6% annualized growth rates, respectively.
Output
California also has been outpacing the nation on the basis of output. Through the first half of 2015 (the latest data available), California grew its gross output at half again the rate of the United States overall, 4.3% compared to 2.7%.
The most rapidly growing sectors from an output perspective included agriculture (28%), management (10%), information (9.4%), and professional services (9.4%).
Sectors that contracted included nondurable manufacturing (-3.9%), private education (-3.4%), and perhaps surprisingly, logistics (-1%).
Exports
California-produced exports slowed toward the end of the year in nominal and real terms—although the losses are smaller once prices are accounted for.
The biggest slowdowns occurred in exports to China. Most categories were down, including Computer & Electronic Products (-4.1%), Agricultural Products (-13.4%), and Non-Electrical Machinery (-13.4%). On the plus side, Transportation Equipment exports rose 1.4%.
Travel/Tourism
Despite the slowdown in trade, the state’s airports remain busy with record numbers of international visitors moving through both Los Angeles and San Francisco international airports. Tourism is hot again and hotels across California are packed. With almost an 80% occupancy rate, it is understandable why new hotels are being built across the state.
Taxes
Taxable sales are above their previous peak by a solid margin, and continue to grow rapidly. The sources of growth are construction, business spending, and hotels/restaurants. Traditional consumer goods are adding little to the pot with inflation at such a low pace.
The state also has been running a substantial budget surplus—driven primarily by personal income taxes. January’s numbers came in well below expectations, however—likely a consequence of the market selloff. If the markets continue to contract this year, or even stay flat, the state may well find itself back in a modest deficit position.
Housing
California’s housing market continues its strong recovery. The mortgage delinquency rate is lower in the state than in the nation overall, and home price appreciation is higher than the national average by a good margin. At the state level, median prices have reached $400,000 for the first time since 2007.
The San Francisco Bay Area leads the way in price appreciation, but Fresno and San Bernardino counties have both seen median prices grow at a double-digit pace in the past year. Home sales are still slow relative to the last peak, but tight inventories and low interest rates have contributed to the ongoing rise in prices.
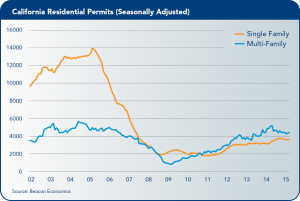
New building permits remain quite weak. Monthly permits ran 3,600 per month in the last few months of the year—compared to 12,000 to 14,000 per month in the middle part of the last decade. Multi-family permits have recovered and ran more than 4,000 for most of the year—on par with past levels.
California has been adding more than 4 new people to its population base for each new building permit—making the current shortage even worse.
 The California Chamber of Commerce Economic Advisory Council, made up of leading economists from the private and public sectors, presents a report each quarter to the CalChamber Board of Directors. This report was prepared by council chair Christopher Thornberg, founding partner of Beacon Economics, LLC.